Let’s welcome Webix 11.2! We are happy to share with you a fresh round of updates, inspired by modern development trends and insightful user feedback. This release brings core enhancements that improve Webix Grid usability, major updates to SpreadSheet, new functionality in Gantt, and refinements throughout the library. No need to wait – let’s move directly to exploring new features!

Core Updates
We’ll begin our overview of the latest Webix features by unpacking the core updates that enhance the user experience on touch devices and offer greater flexibility when working with Google Maps.
Column Resize on Touch Devices in Webix Grid
This time the major core update is the introduction of the column resize on touch devices in Webix Grid*. The new feature significantly enhances the usability of the widget, making it more intuitive and accessible for users on touch screens. Now, you can simply drag the icon that is rendered in both the table header and footer to adjust column width on your tablet, mobile phone, or hybrid device.
Touch-resizing is enabled via the new icon property in the resizeColumn object configuration:
resizeColumn: { icon: true },
});
The icon property set to true activates live resizing of columns by default. This means that the table updates continuously while the user drags the resize icon.
Webix Grid live demo >>
Try it on mobile >>
Datatable live demo >>
Try it on mobile >>
This approach improves real-time responsiveness of the grid, but has a higher performance impact if compared to the original resize mode where the redraw of the content takes place after the drag is completed.
To avoid performance issues, we recommend disabling live resizing in datatables with a large number of columns. To do this, set the new live property in the resizeColumn object configuration to false:
resizeColumn: { icon: true, live: false },
});
Webix Grid live demo >>
Try it on mobile >>
Datatable live demo >>
Try it on mobile >>
One more important thing to note is that the new resize feature was designed so that neither the icon nor live properties affect the existing resize mode in any configuration – and vice versa.
*Over a month ago, we introduced Webix Grid as a standalone product. All updates received by Grid are also applied to the DataTable component in Webix Core.
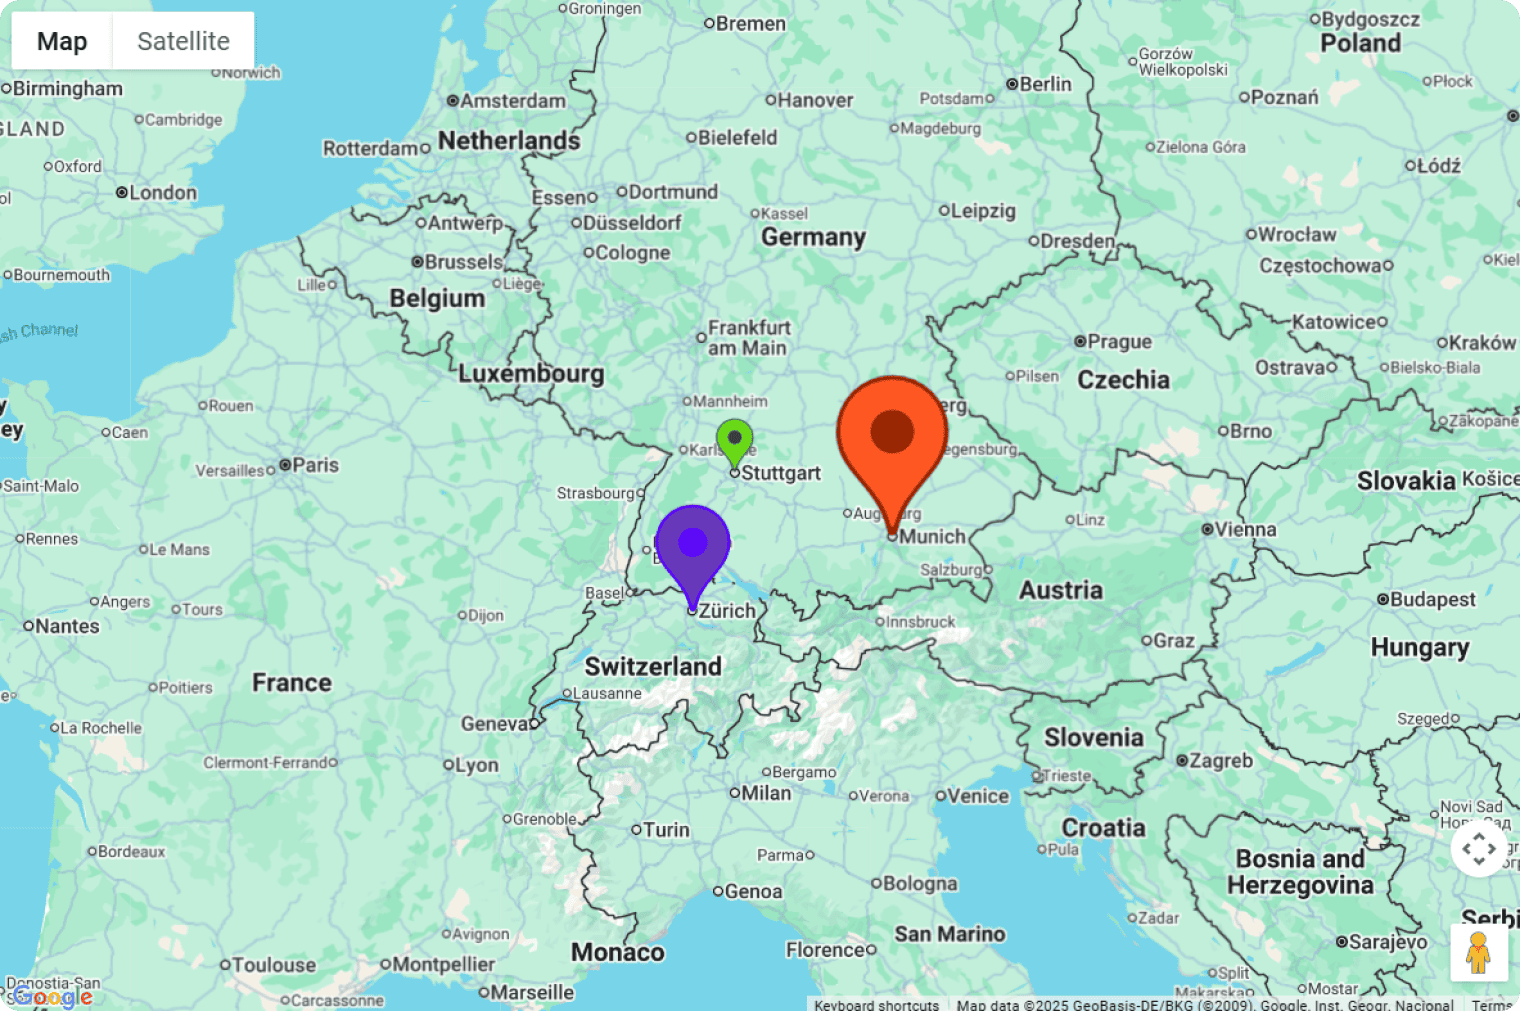
Migration to the Advanced Google Marker
One more update involves migrating from the simple to the advanced Google Marker. This marker is integrated into the Webix GoogleMap widget, which is designed for handling geographical data. The transition enables flexible customization – markers can now contain any HTML content and support interactive behavior, such as expanding on click. Advanced markers use a more flexible approach to animation, which is handled via JavaScript and CSS, in contrast to simple markers that relied on built-in animation methods.
With the introduction of the advanced marker the configuration of the Webix GoogleMap widget has been extended with new properties:
- mapId – a required property that must be set with the unique identifier. This way you activate features and get control over the behavior and style of your map;
- template – a function that enables developers to define custom rendering logic for advanced markers and generate fully customized marker elements. For example, you can style the default pin element by changing its size and color.
SpreadSheet Updates
Looks like SpreadSheet truly steals the spotlight this time – the widget has received an impressive list of enhancements designed to streamline workflow and elevate the user experience. We’ll start by reviewing the latest SpreadSheet features, including recent API improvements.
Smart Fill: Days and Months
In version 11.2, SpreadSheet introduced a new feature that simplifies user input – autofill for days and months. To see this new capability in action, select a cell (or groups of cells) and hover over its bottom-right corner until you see the fill handle (a plus sign).Then, stretch the handle (horizontally or vertically) across the cells you want to populate with data.
The new feature is locale-based and uses values from the webix.i18n.calendar object – specifically dayShort, dayFull, monthShort, and monthFull properties. As a result, the autofill supports both short and full formats for day and month names.
It also preserves the original letter casing when populating cells with values. When users enter lowercase (e.g. jan, january) or uppercase (e.g. JAN, JANUARY) values, SpreadSheet applies the corresponding autofill to the cells. For all other variations (e.g. JAn, JAnuary), casing is determined by formatting rules of the current locale.
New Array Method Category
This time, Webix engineers have introduced a new group of methods to SpreadSheet: array methods. Alongside the existing categories – common, text, number, date, and financial – users now have access to dynamic array functions*. The newly added methods allow filtering, sorting, slicing arrays, converting data into single rows or columns, splitting text into structured arrays, and more. To see all of them check out the complete list of the new built-in Excel functions. If you want to implement pivot-style functionality similar to Excel’s GROUPBY and PIVOTBY methods, we can offer a how-to guide to transform SpreadSheet data into a Pivot view.
To enable array methods in your SpreadSheet, include the methods parameter with the name of this category in the widget configuration:
view: "spreadsheet",
toolbar: "full",
methods: "array",
});
Alternatively, you can set the methods parameter to
“all” and activate all method categories, including the
array group:
view:"spreadsheet",
toolbar:"full",
methods:"all"
});
Try out the live demo below to check the complete set of array functions.
*Note that dynamic array functions were introduced in recent versions of Excel. Depending on the user’s version, they may not be available to all recipients of the exported file.
Common Structure for Menu and Toolbar
From now on, the SpreadSheet toolbar and menu have the same set of elements for the same actions. This makes them easier to manage and extend.
Unified Structure and Actions
We refactored and unified internal structures of the SpreadSheet toolbar and menu. Now, both components rely on the same JSON configuration. Same IDs, same settings, same text for labels and tooltips, same actions. We kept the menu simple and left out a couple of actions with complex input, such as colors and borders.
We had to make some changes in configuration and localization, so please check out the Migration guide.
Improved Localization
We updated locale structure for improved localization of menu labels, toolbar tooltips, and custom menu items. We moved all shared text displayed in the menu and the toolbar to a common locale group and optimized the way these components are localized. For detailed information, please check the documentation.
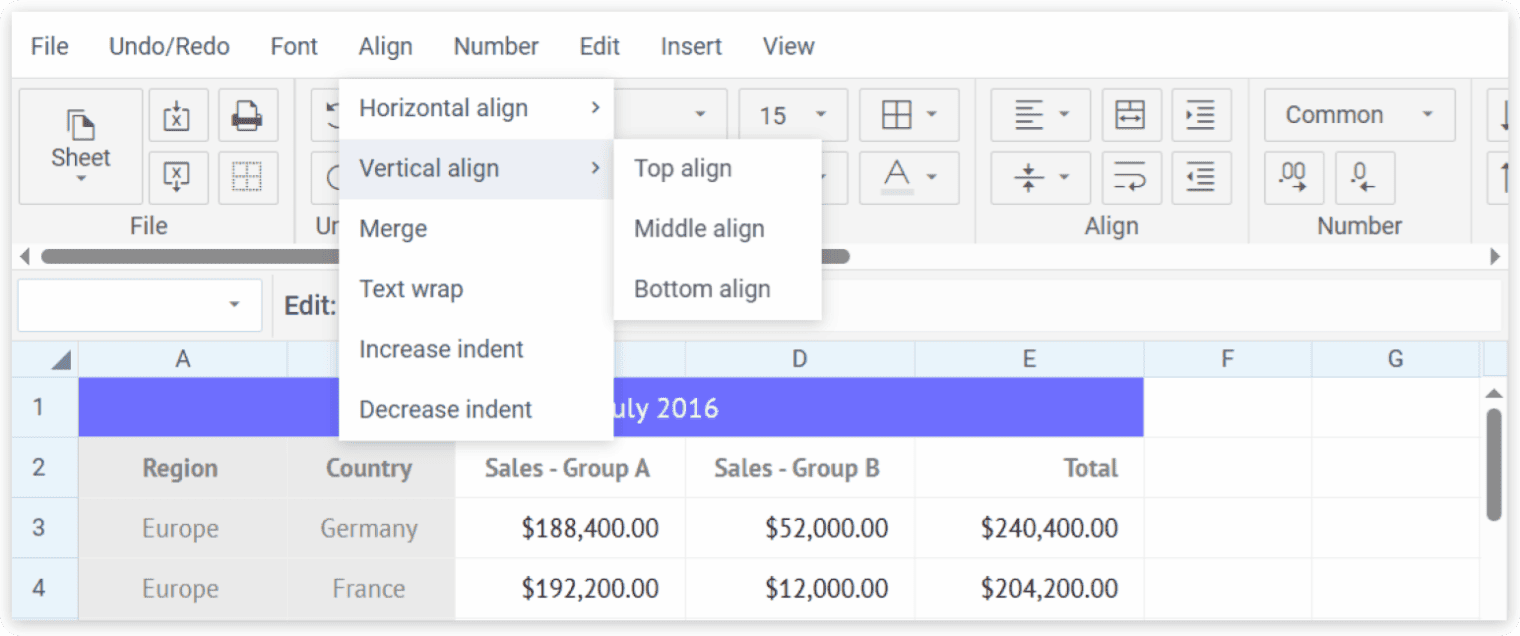
Defining Cell Formats via the Context Menu
Now, SpreadSheet users can format entire rows or columns via the context menu. This new capability complements the existing option to change a row’s or column’s format by clicking its header and selecting a format from the dropdown menu in the Toolbar (Number section).
Live demo >>
Inheriting Formats
In previous versions, when users added a new row or column to their SpreadSheet, the inserted cells inherited a default common format.
Starting with version 11.2, Webix introduced smart formatting for newly added rows and columns:
- cells in new rows now inherit formatting from the cells of the row directly above;
- cells in new columns receive formatting from the cells in the column immediately to the left.
Enhancing getFormat Method
In this update, we’ve continued to enhance the SpreadSheet API. This time we’ve upgraded the getFormat method, which was originally introduced in version 11.1 to retrieve the name of a cell’s format.
To make it even more functional, the method returns an object containing both the format name and the format itself, which is a set of formatting rules applied to a cell. Take a look at this snippet to see the change in action or check the code example below:
webix.message(JSON.stringify(name));
//{"name":"price","format":"[>=0][$$]#,0.00;[<0]-[$$]#,0.00"}
Introducing getCellType method
Previously, to extract a cell’s type, developers had to serialize the entire SpreadSheet dataset, which could be resource-intensive when working with large volumes of data.
We’ve taken care of this and extended the SpreadSheet API with a new getCellType method that allows getting the type of a specific cell with no need for extra actions.
Check the code example below or experiment with this snippet to see how the new method works.
Introducing loadStyles Parameter
SpreadSheet can handle large volumes of data, but for massive files, style import may significantly impact performance. To address these special cases, we’ve added an option to completely ignore styles.
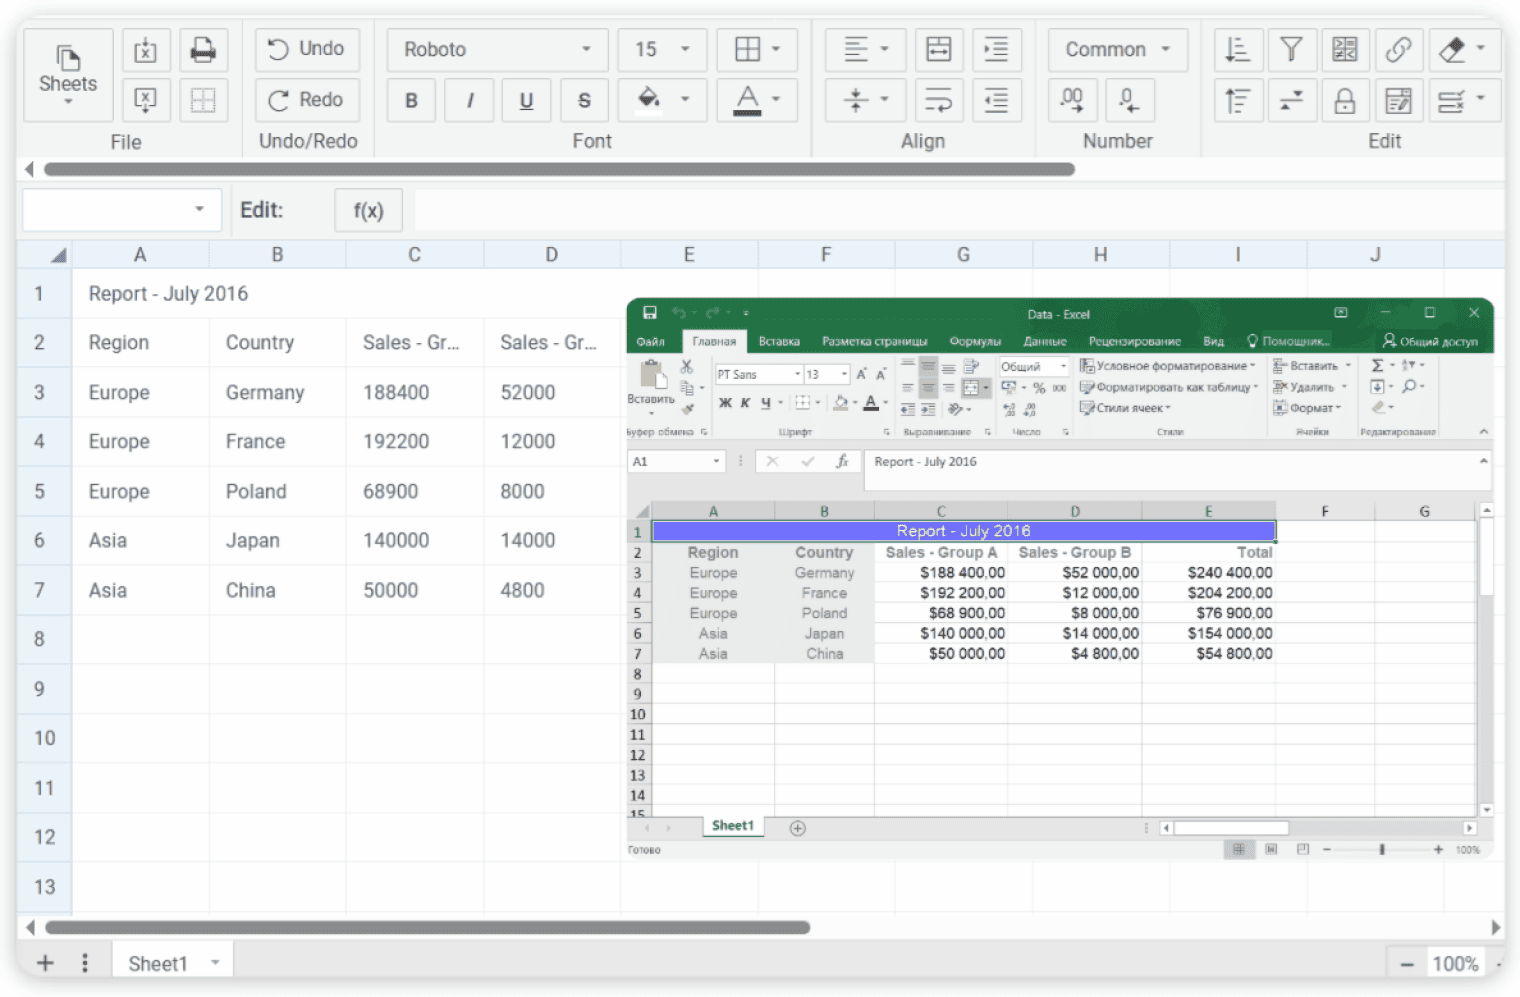
Now, you can control whether Excel styles are imported into your SpreadSheet via the loadStyles parameter, which can be set to true or false. By default, it’s set to true, meaning files will be loaded with all associated styles. But you can configure this parameter to false, thereby skipping style import.
Gantt Updates
In version 11.2, Gantt introduced an update that enables automatic scrolling to a specific date within the chart. This functionality is controlled via the newly added date property. To activate it, include the property in your Gantt configuration and assign the desired date value. The chart will automatically scroll to the specified date. Make sure the date falls within the chart’s start and end boundaries – otherwise, it will scroll to the start or the end of the scale.
Other Updates
Check out the What’s New page for a complete overview of the latest improvements and enhancements introduced by the Webix team. To get the library itself, upgrade via npm, Client area or click the big purple button below.