Selecting the right Data Grid for your app ensures both – robust performance and a better user experience. Today, we are going to check out which JS Data Grids are ranked highly by users all over the world as reliable and handy tools for aggregating and managing large datasets.

Last updated: January 13, 2026
Let’s first start with a very quick reminder of what a data grid is. A data grid or a data table is a component that renders data in a tabular format and allows performing operations with data, like filtering, sorting or editing. Most modern solutions offer built-in visualization options – like charts or sparklines – that illustrate the data flows of an app.
You can for sure design your own data grid, but let’s be honest – it rarely justifies the time and effort spent. Ready-made solutions save you resources, delivering reliability refined by engineering teams.
With that in mind, let’s now move on to the list of best JS Data Grids and look at their key features, advantages, use cases, and pricing among the market’s top players.
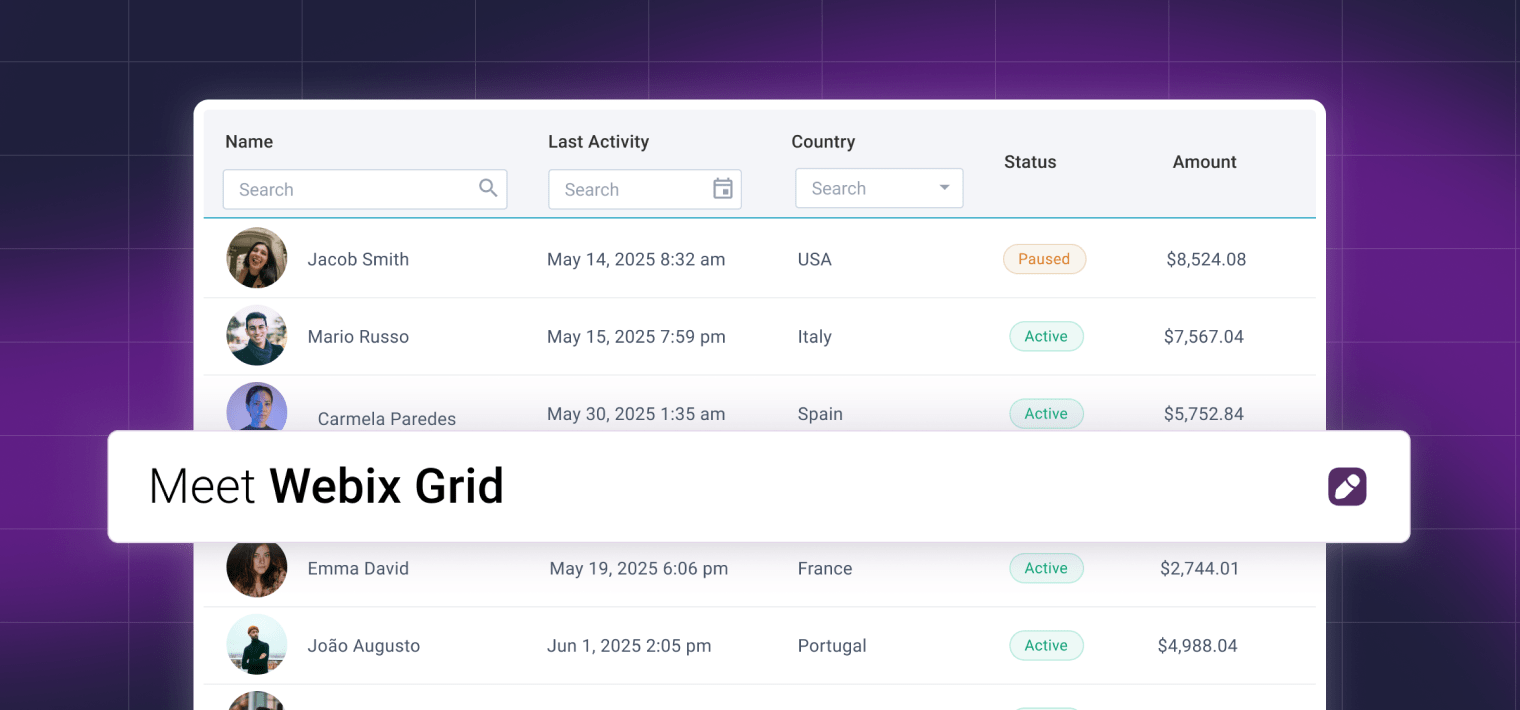
Webix Grid
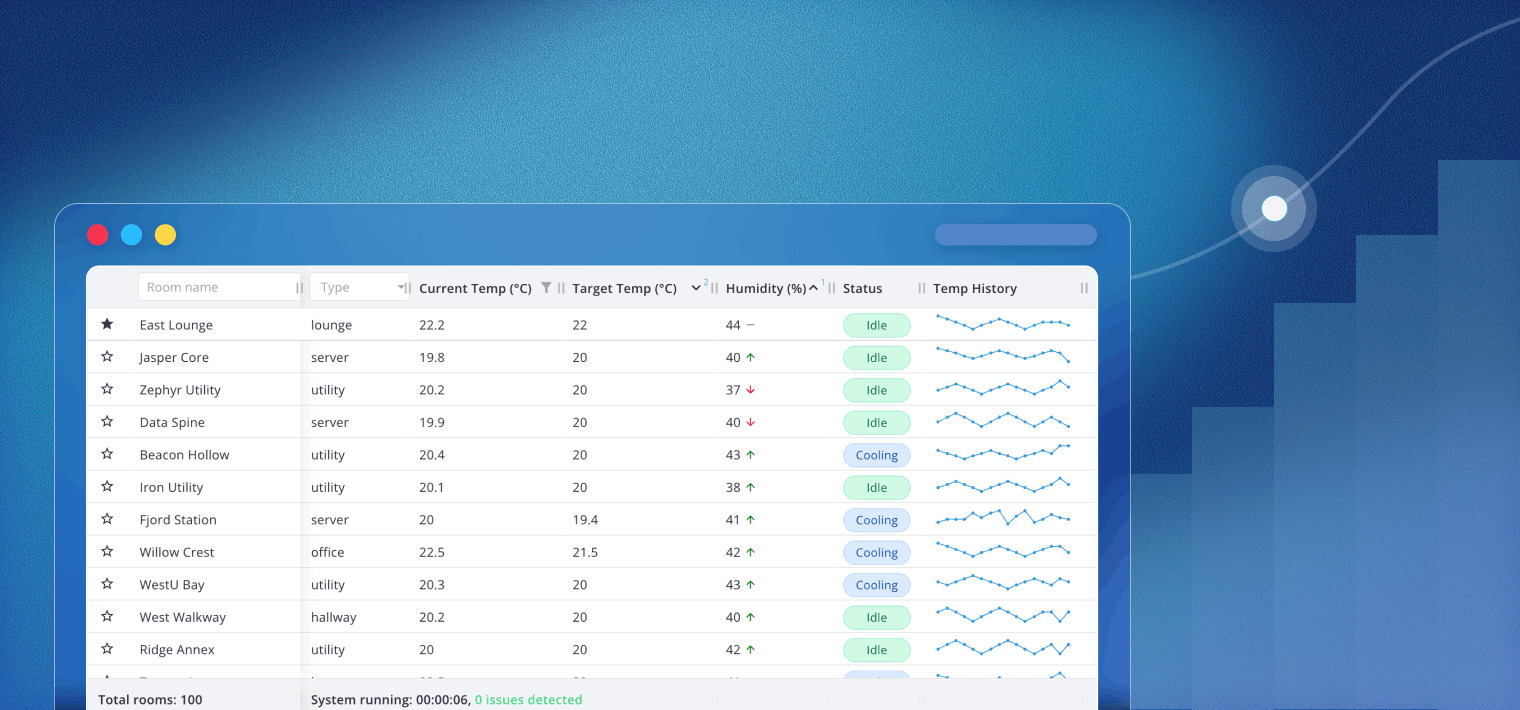
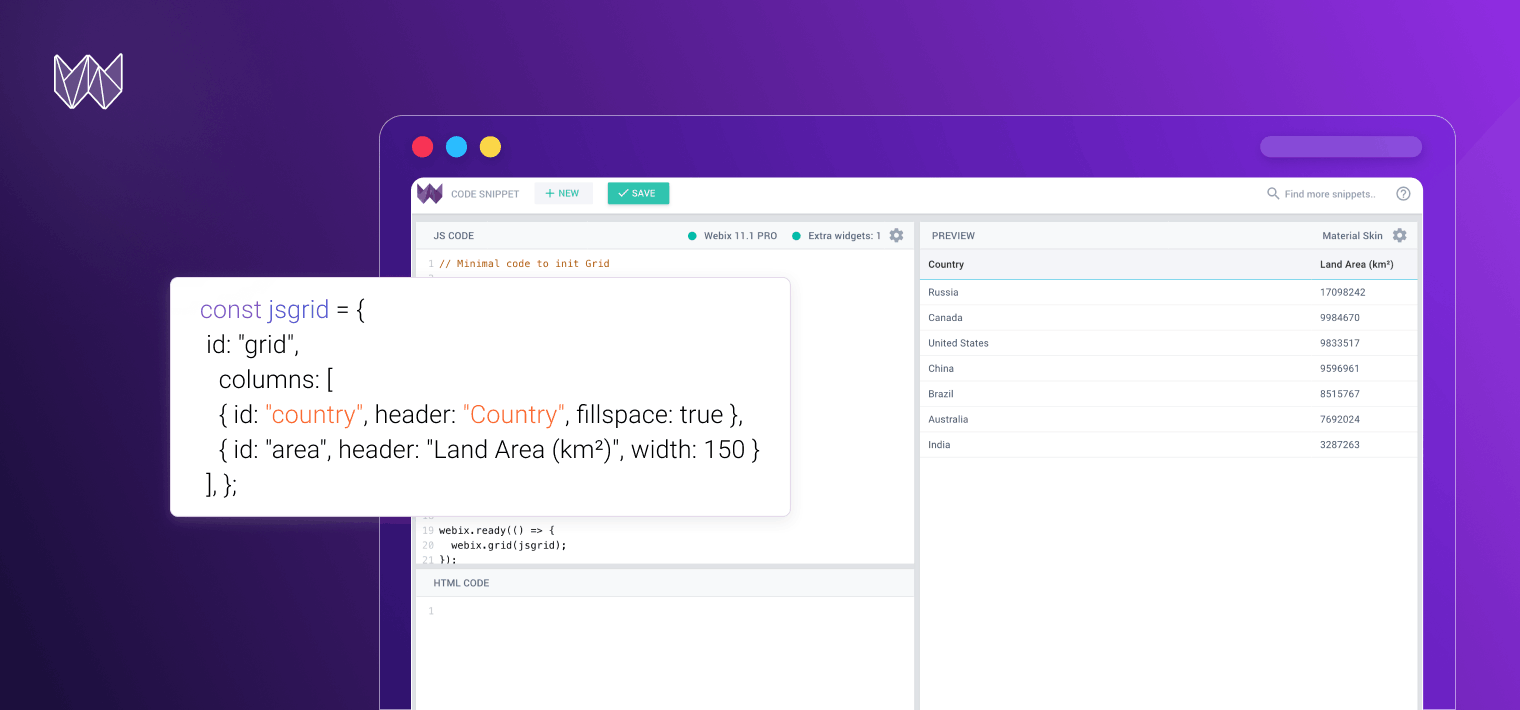
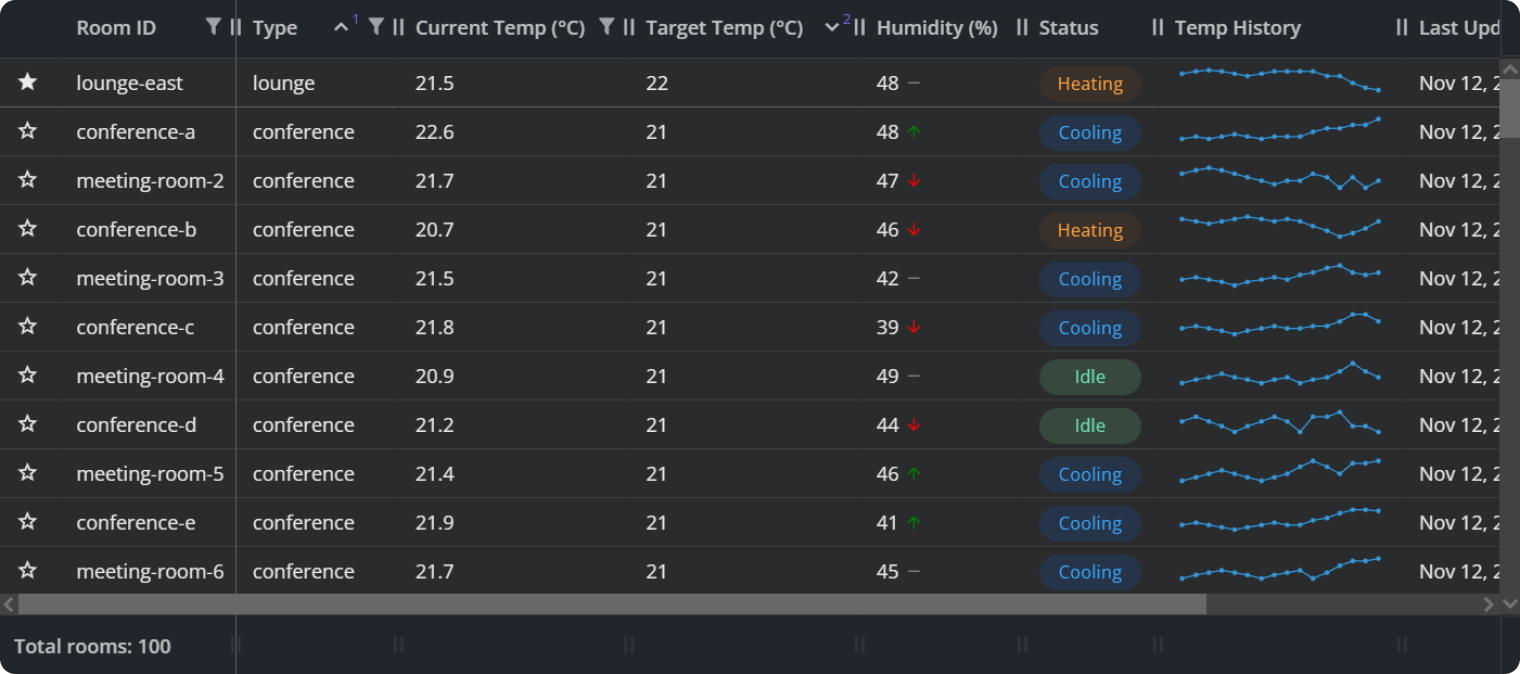
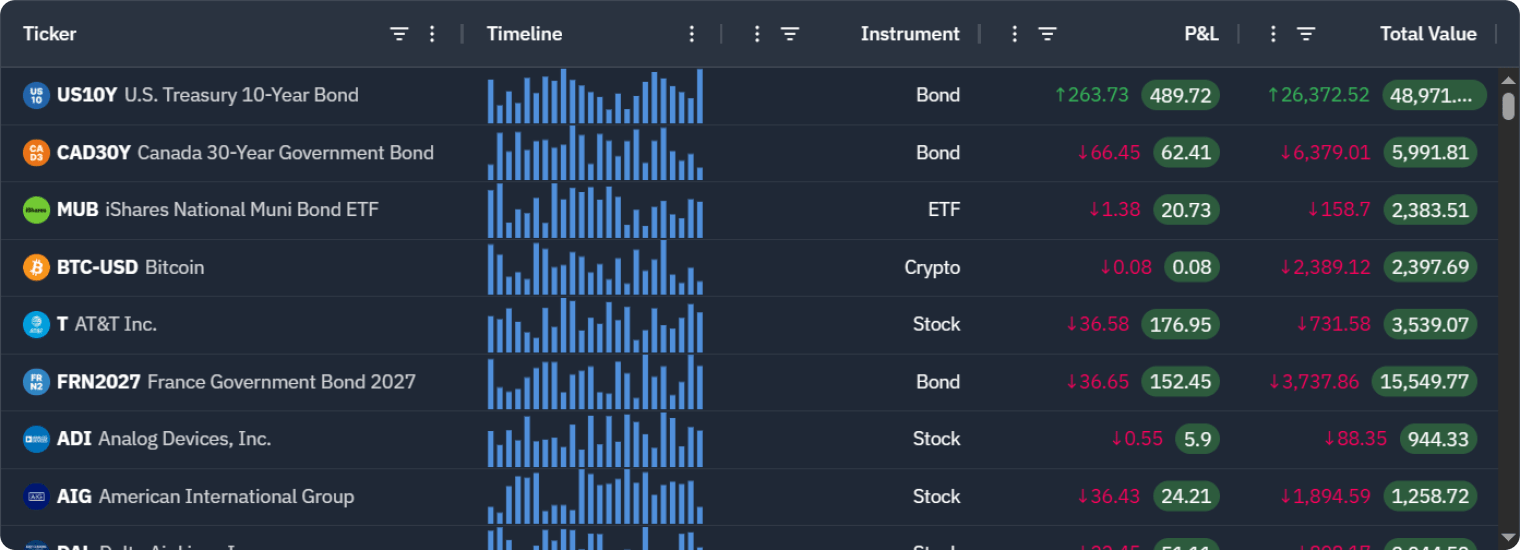
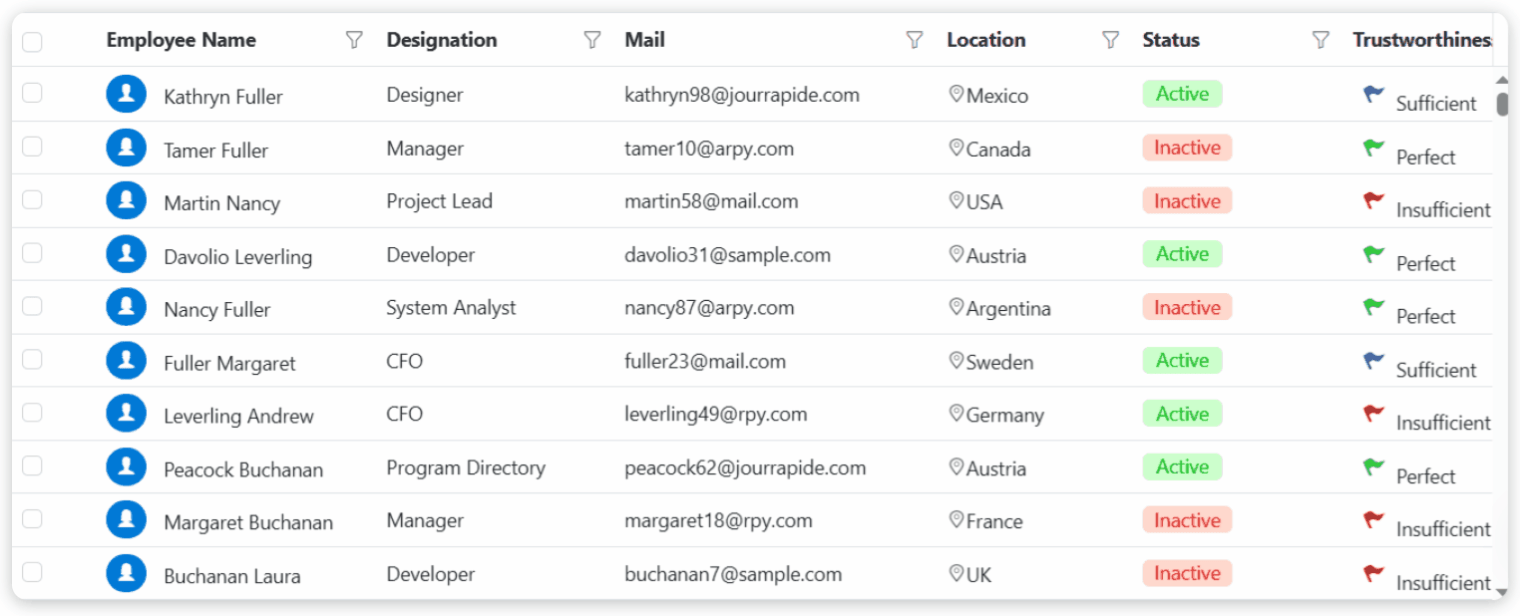
Webix JavaScript Grid is a JS data grid released by Webix as a separate package, independent of the main library. Now, users have the possibility to utilize this popular data management component by installing it via npm. Webix Grid has made a name for itself among other data handling solutions for its cutting-edge performance that relies on special rendering techniques. The GPL version (community) data grid also delivers the fastest render time among competitors. These techniques allow it to preserve consistently high loading speed irrespective of the number of records. Alongside its rendering efficiency, Webix Grid is packed with a complete set of advanced features that make it well-suited for managing complex systems.
Webix Grid core features:
- Automatically configured columns based on the data passed to the Grid
- Dynamic index columns
- Row and column spans
- Possibility to load grid configuration from the server or external file
- Allows rendering subrows and subviews
- Split mode for freezing rows and columns
- Drag and drop between grids
- 17 built-in filters and 12 editors
- Ability to load data with math formulas that will be parsed by the grid
- Sparklines for data visualization
- Skins for styling
Key strengths:
- Steady rendering speed with an increasing number of records
- Handles large datasets
- Highly customizable solution – you can easily configure the style and behavior of the component
- Robust feature set for comfortable data handling
- Easy installation via npm or using local files
- No extra dependencies
Licensing & pricing: available under a free GPLv3 license and in a commercial version that starts at $749.
When to choose: the grid is best suited for ultra-fast rendering and performance-critical dashboards.
AG Grid
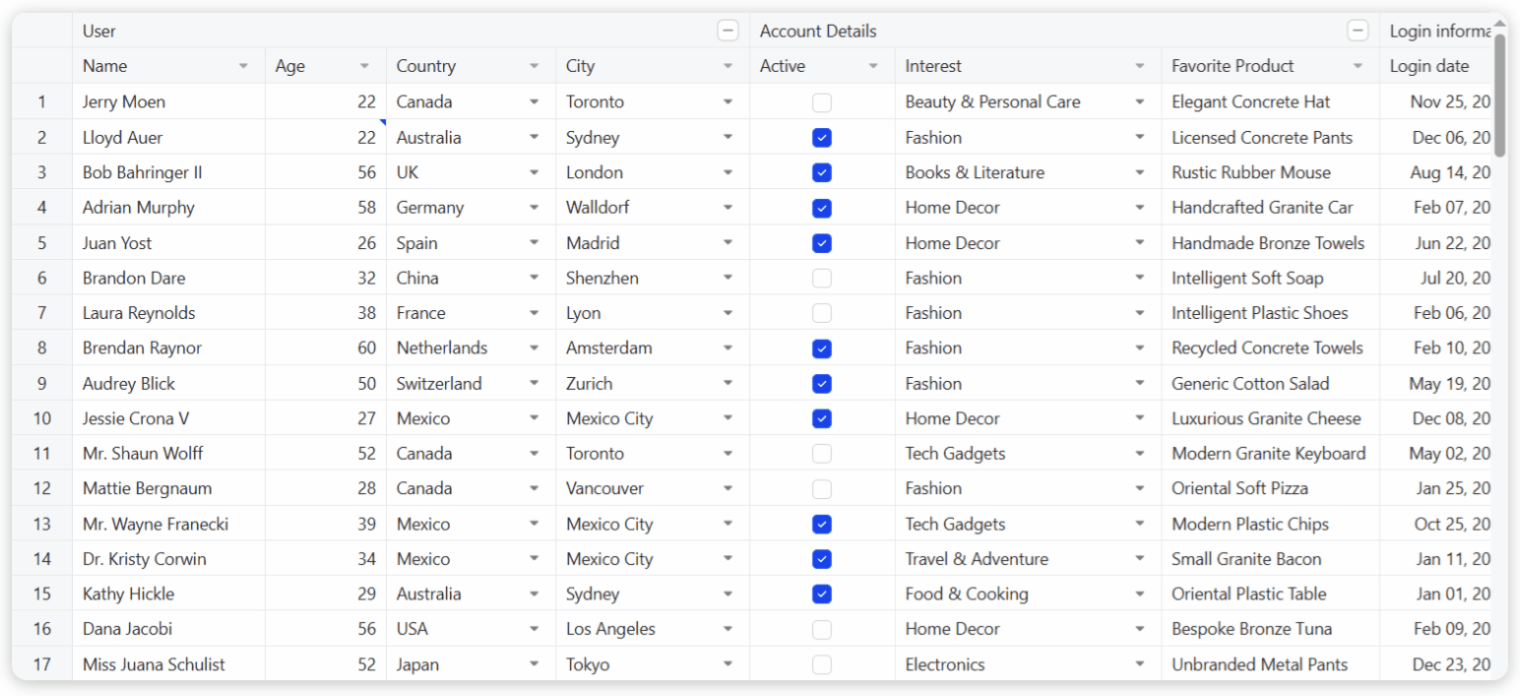
AG Grid is a native JavaScript grid that provides dedicated packages for React, Angular, and Vue. This means that the engine AG Grid has in its core is supplied with React, Angular, or Vue wrappers to facilitate integration with most popular frontend frameworks. The component is enterprise-ready and capable of managing complex enterprise-level systems, delivering high-speed data processing.
AG Grid core features:
- Built-in charts for data representation (sparklines, standalone or integrated charts)
- Dedicated design system for fast prototyping
- Tree structure support (including Tree Data filtering)
- Built-in animation triggered by row actions
- Comprehensive API that allows you to programmatically adjust the component as required
- Advanced tool panels for quick access to the available grid actions
- Pivoting capabilities for exploring data interactively
Key strengths:
- Advanced data handling features (aggregation, grouping, pivoting)
- Enterprise-grade performance
- Extensive customization options
- Straightforward integration with external systems (e.g. backend services)
Licensing & pricing: available in two editions – a free open-source (MIT license) and a commercial version that starts at $999.
When to choose: a smart choice for high-performance enterprise data visualization.
Bryntum Grid
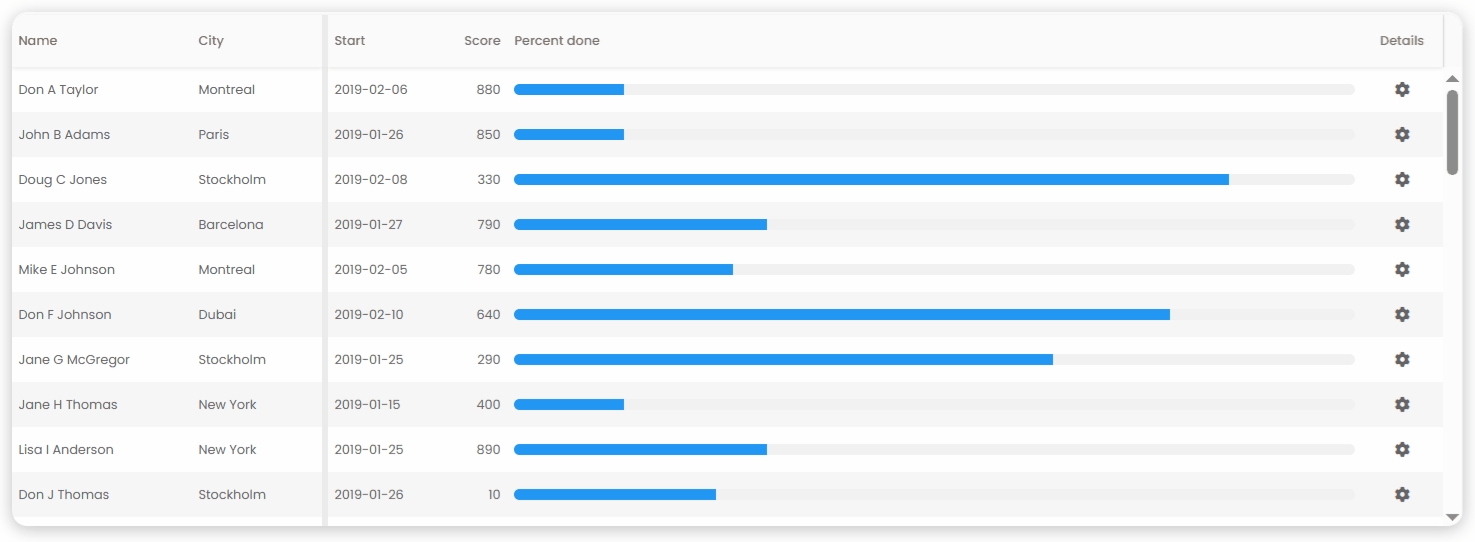
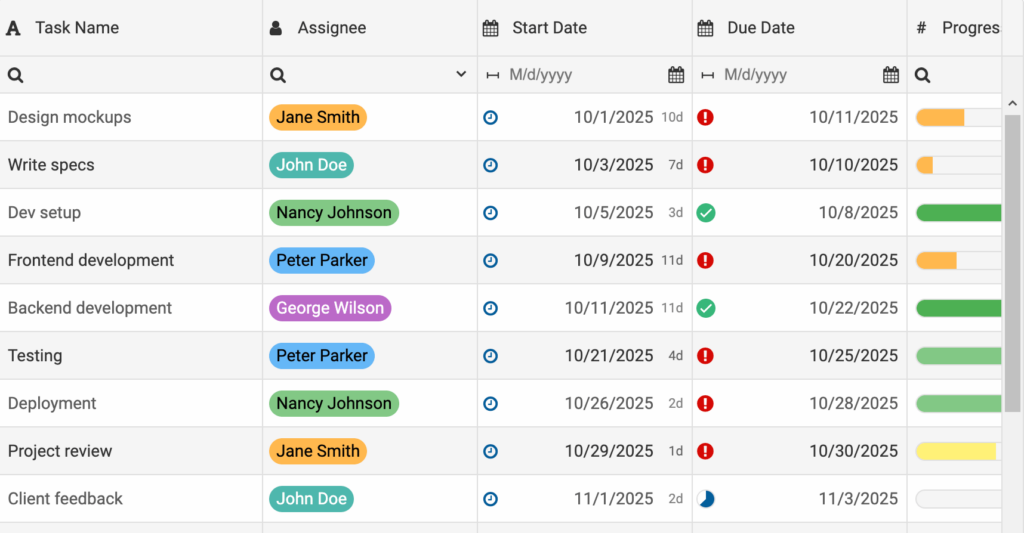
Bryntum Grid is a component developed in native JavaScript and shipped with official wrappers for React, Angular and Vue. Bryntum takes a different approach to its grid architecture, basing it on the concept of subgrids. Unlike other libraries that utilize a single grid instance, Bryntum uses explicit subgrids, each with its own configuration and subset of columns (e.g. for features like frozen rows). This approach can be beneficial in case you need multi-region layouts and advanced UI control.
Bryntum core features:
- Rows pinning to the top of the grid
- Grouped headers that can be rearranged via drag and drop
- Infinite scrolling
- Summary cells
- Locked(frozen) columns
- Separate scrollable subgrids
- SASS-based theming
- No server dependency (backend-agnostic)
Key strengths:
- Comprehensive customization options
- Flexible API
- Subgrid architecture
- Thorough testing with the in-house testing framework Siesta
Licensing & pricing: the component is only available under a commercial license at a minimal price of $600 per developer.
When to choose: best fit for highly interactive UIs with complex layouts.
DHTMLX Grid
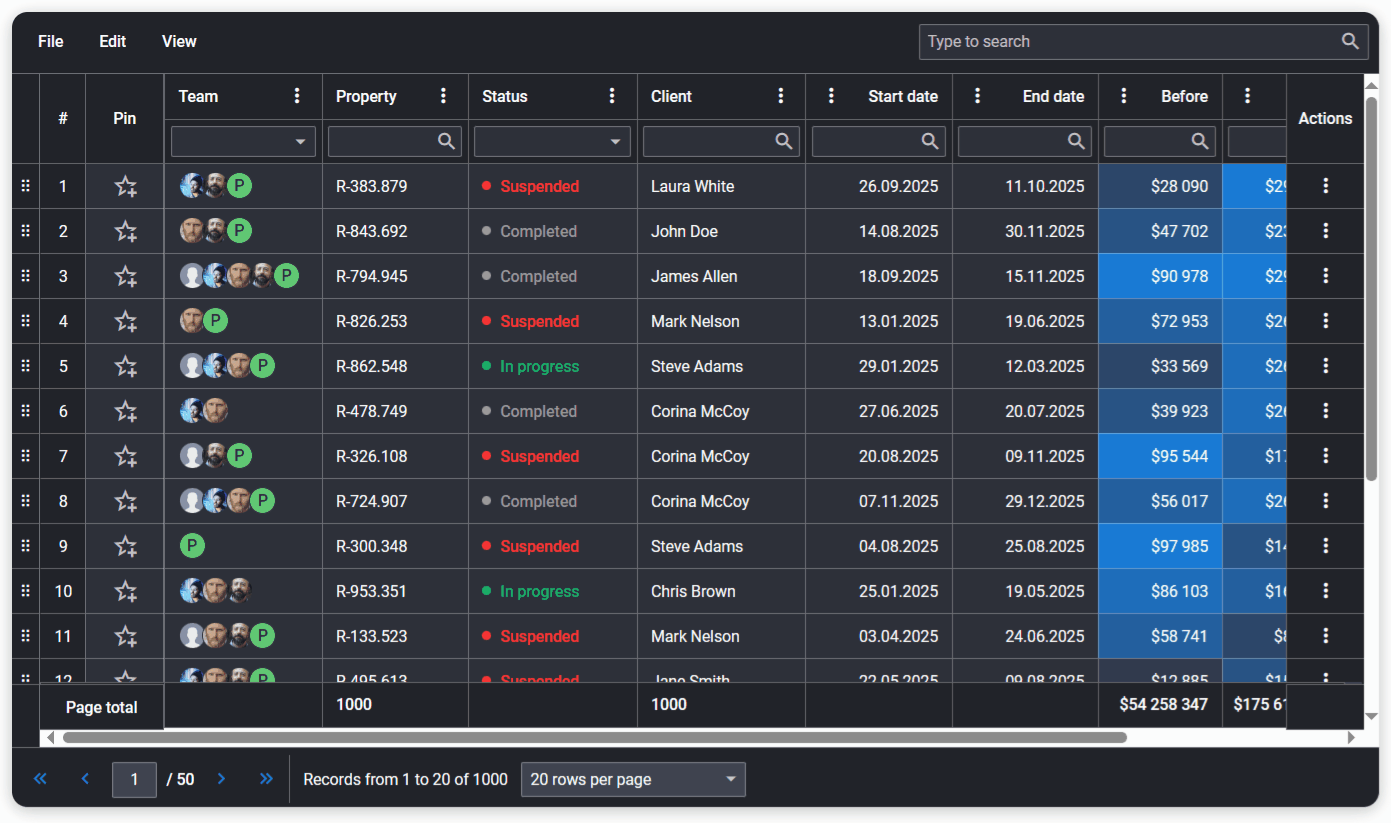
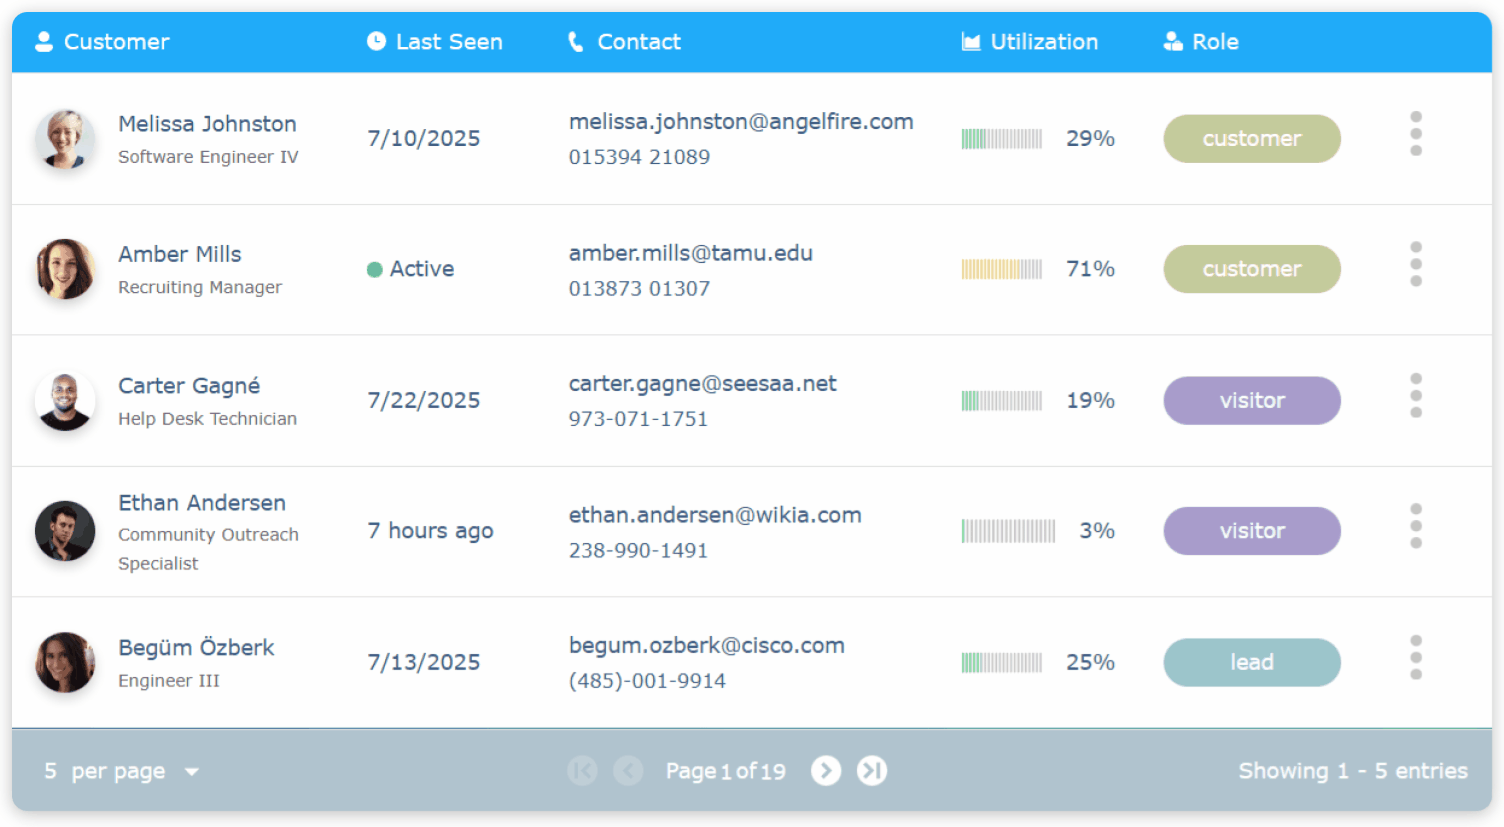
DHTMLX Grid is a standalone JavaScript data table designed to facilitate data analysis in enterprise-grade web apps. The open-source edition of the component offers basic grid functionality, while its PRO version provides a wide range of advanced features and official tech support for more complex scenarios.
DHTMLX Grid core features:
- Advanced data grouping and multi-sorting for effective data analysis
- Custom statistics (summary) in the column header/footer and spans
- Row expander for using nested content in Grid sub-rows
- TreeGrid mode for displaying hierarchical data structures
- Smooth drag-and-drop of columns and rows
- HTML content in Grid cells
- Different built-in column editors
- Auto height mode for Grid
- Frozen columns and rows
- Exporting Grid data to PDF, PNG, Excel, and CSV formats
Key strengths:
- Flawless performance with large datasets (e.g. renders 100,000+ rows in milliseconds)
- Highly configurable Grid items (rows, columns, editor types, spans, data formats)
- Fully customizable look and feel via HTML templates, CSS, and built-in themes
- Spreadsheet-like interactions with the table (history management, clipboard operation, range selection, etc.)
- Simple integration with top frontend frameworks (React, Angular, Vue, Svelte) and backend platforms that support RESTful API
Licensing & pricing: the open-source version of DHTMLX Grid (Standard Edition) is distributed under the GPL v2.0 license. The paid PRO version starts at $749.
When to choose: a solid solution for enterprise analytics and hierarchical data presentation.
jqxGrid (jQWidgets UI)
jqxGrid is part of the jQWidgets UI library and is designed for building fast, reliable, data-intensive interfaces. The grid focuses on performance and predictable behavior, making it a strong choice for applications where speed and simplicity matter more than complex configuration.
jqxGrid core features:
- Virtual scrolling and paging for efficient work with large datasets
- Sorting, filtering, grouping, and aggregates
- Inline cell and row editing
- Flexible cell customization
- Strong keyboard navigation support
Key strengths:
- Extremely fast rendering, even with large volumes of data
- Lightweight architecture with low configuration overhead
- Simple, predictable API
- Optimized rendering for smooth interaction
- Works well in performance-critical environments
Licensing & pricing: available under a commercial component license starting from $199 for a one-time per-developer fee, providing a perpetual, royalty-free license with source code and unlimited projects.
When to choose:
Well suited for straightforward and performance-critical data grids, especially in applications where fast rendering, stability, and ease of integration are priorities.
Syncfusion DataGrid
Syncfusion DataGrid belongs to Syncfusion’s control library. The grid is available as part of the full framework suite and is widely used for solving corporate-level tasks due to the broad set of enterprise-valued features it offers.
Syncfusion core features:
- Column pinning and spanning
- Column menu with multiple options (autofit, grouping/ungrouping, filter, etc.)
- Rows editing via a popup form
- Column validation, including the possibility to apply your custom validation rules
- Reactive aggregates that recalculate dynamic data on the fly
- Context menu
- Multiple charts for graphic data presentation
Key strengths:
- Highly adaptive layout (mobile-first approach)
- Uses a feature modules concept that allows adding only the functionality you need
- Provides Excel-like editing
- Efficient at rendering large-scale data
Licensing & pricing: offers a community version that is free for individuals and small businesses, as well as a commercial version (pricing quotes are available upon request).
When to choose: well suited for full-featured enterprise apps built with the Syncfusion ecosystem.
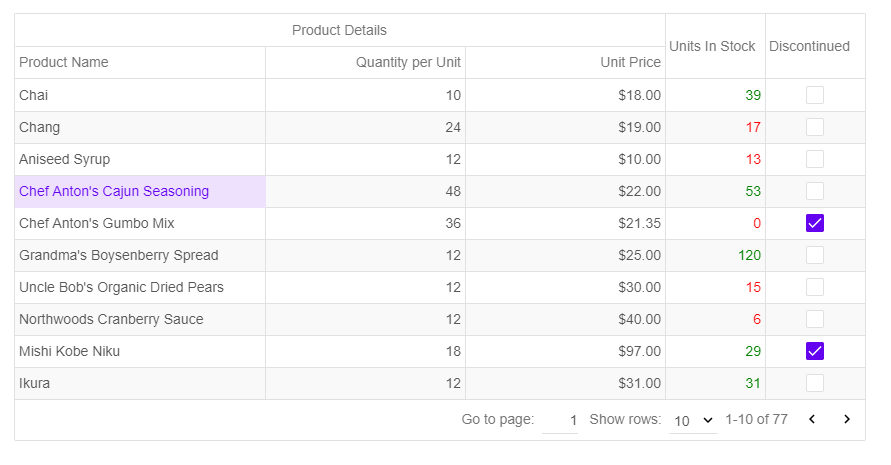
Handsontable
Handsontable is a JS data grid that combines the functionality of a table and a spreadsheet, providing an interactive Excel-like experience to its users. In simple words, it supports Excel-style functions in addition to general data grid features. You can integrate the table into the frontend of your app written in React, Angular or Vue – Handsontable comes with corresponding wrappers for its component.
Handsontable core features:
- Validation rules (predefined or custom) for grid cells
- Advanced sorting by multiple criteria
- Conditional formatting for the content of grid cells
- Multi-level column headers
- Row trimming that allows hiding specific rows, avoiding their rendering
- Adding comments to cells (you can edit, delete and make them read-only)
- Support for extending grid’s functionality via custom plugins
- Coverage of more than 400 Excel formulas
Key strengths:
- Extended functionality – combines both the data grid and spreadsheet capabilities
- Excel-like experience with familiar interface
- Virtualization that guarantees high performance when managing big data
- Advanced design system that allows customizing grid styling to align with the design of your app (users can adjust design tokens in Figma and then generate CSS styles for their app)
Licensing & pricing: offers a free community version for non-commercial purposes and a commercial license that starts at $899.
When to choose: a solid choice for systems that require a grid enhanced with spreadsheet capabilities.
Smart.Grid
Smart.Grid is part of the Smart UI component suite and is built for advanced data presentation and interaction. It targets applications that require a rich feature set, high flexibility, and scalability for complex data scenarios.
Smart.Grid core features:
- Advanced filtering, including multi-level and complex filters
- Complex grouping and column customization
- Rich editing scenarios
- Custom cell templates
- Built-in data and UI virtualization for large datasets
Key strengths:
- More advanced feature set for sophisticated data scenarios
- High flexibility through extensive configuration options
- Optimized rendering with virtual scrolling
- Consistent APIs across Vanilla JS, Angular, React, and Blazor
- Suitable for feature-heavy, interactive interfaces
Licensing & pricing: available under a commercial component license with a one-time fee per developer, allowing use in unlimited web applications, SaaS projects, intranets, and websites.
When to choose: Best suited for complex, highly interactive data grids that require advanced data handling, customization, and long-term scalability.
ZingGrid
ZingGrid is a framework-agnostic data grid written in pure JS that can be integrated into web apps built with Vanilla JavaScript or modern frameworks. It doesn’t require any wrappers to work in React, Angular, Vue, or Svelte projects. Simply import the library into your app and use the grid as a custom component.
ZingGrid core features:
- Batch editing that allows users to edit/insert/remove multiple rows at a time
- Conditional formatting for styling or injecting cell content based on specific conditions
- Adapters that simplify connection to external data sources, like GraphQL, Firebase, or Django
- Crosshair feature that spotlights the entire row and column intersecting the cell a user hovers over
- Drilldown for presenting more detailed information associated with a specific row
- Compliance with accessibility standards
Key strengths:
- Advanced customization options via APIs for granular control over the functionality of the grid
- Ready-to-use, framework-agnostic tool
- High performance ensured by infinite scrolling, optimized rendering and server-side paging
Licensing & pricing: free for non-profit purposes, its commercial single-domain license starts at $100.
When to choose: in case you prioritize quick integration with JS frameworks, minimal setup, and can do without some advanced enterprise features.
Conclusion: Which Data Grid to Choose
In this article, we highlighted grid components that stand out for their unmatched performance, adherence to modern standards and the variety of refined tools they provide to businesses. Behind each of them is the extensive work of professional teams that continually improve their product, enabling organizations to focus on their pressing tasks, rather than spending significant resources on development.
Final Take: Head‑to‑Head Comparison
To help you quickly compare the discussed solutions, here’s a summary table highlighting the key differences between all data grids.
| Grid Name | Framework Support | Free Version | Best For |
| Webix Grid | Vanilla JS, React, Angular, Vue | Yes (GPLv3) | High-performance business apps |
| AG Grid | React, Angular, Vue | Yes (MIT) | Pivot & charts |
| Bryntum Grid | React, Angular, Vue | No | UI flexibility |
| DHTMLX Grid | React, Angular, Vue, Svelte | Yes (GPLv2.0) | Analytics and hierarchical data handling |
| jqxGrid | Vanilla JS, Angular, React, Vue, jQuery | Limited (Trial/eval) | Lightweight data apps |
| Syncfusion DataGrid | React, Angular, Vue, Svelte | Yes (Community) | Enterprise apps |
| Handsontable | React, Angular, Vue | Yes (Community) | Spreadsheet-like UI | Smart.Grid | Vanilla JS, Angular, React, Blazor | Limited (Trial) | Complex data scenarios |
| ZingGrid | Any | Yes (Non-profit use) | Simplicity |
As you can see, each grid occupies its own niche: some are focused on performance, others on flexibility or a user‑friendly UI. If you’re looking for a high‑performance DataGrid that will ensure seamless data handling in 2026, try Webix Grid and explore its capabilities – it’s completely free. Our detailed documentation and friendly forum community make this component an ideal choice for teams seeking a powerful, accessible, and well‑supported JavaScript grid.