TL;DR: This article includes detailed performance metrics and interactive demos that showcase rendering speed, DOM stability, scrolling smoothness, and real-world usage scenarios. Webix Grid stays fast and responsive even with massive datasets and real-time updates. Its efficient rendering and stable performance make it a reliable choice for data-heavy apps.
What a Data Grid Is and Why It Matters in Modern Web Apps
Today, I invite you to explore Webix Grid performance and functionality with me. But before we dive into details and examine all the metrics, let’s review the basics and clarify what a data grid is. Actually, it’s a table that displays your data in a structured way – that’s the core idea. It can be a simple component written in plain HTML and JavaScript or a more advanced tool that supports interactive data manipulation.
In fact, the most important thing it does is automating how you work with data by taking care of accurate data representation, managing state for all interactions, and handling operations like sorting or filtering through efficient algorithms. Doing all of this manually would be a nightmare.
In modern applications that process large information flows, the challenge is no longer simply having a grid, but ensuring that it performs well under real-world load: large datasets, frequent updates, and complex interactions. And that’s the focus of this article.
As we move forward we’ll review, test, explore the strengths and most prominent features of Webix Grid – to finally see why this solution stands out among modern data-management technologies.
Webix Javascript Data Grid: Quick Overview
Webix Grid is a lightweight JavaScript grid component that combines industry best practices with its own engineering solutions, resulting in the highest performance among its competitors. It offers a really wide set of features that includes both essential and pro-grade functionality, such as advanced sorting and filtering, built-in editors, math operations on data, column grouping, frozen rows and columns, and much, much more. Another advantage of the component is that it’s ready for integration with modern frontend frameworks, so you can be sure that everything will work smoothly once you integrate it into your project. Now let’s go through the strong points of Webix Grid and check some performance metrics to see its standout capabilities.
Core Features of Webix Grid
Virtual Scrolling for Large Datasets
In this part of the article, we’ll look at Webix Grid performance in practice, and I’ll also comment on the architectural choices that drive its outstanding runtime efficiency.
Rendering Speed Benchmarks (1,000 to 1,000,000 Rows)
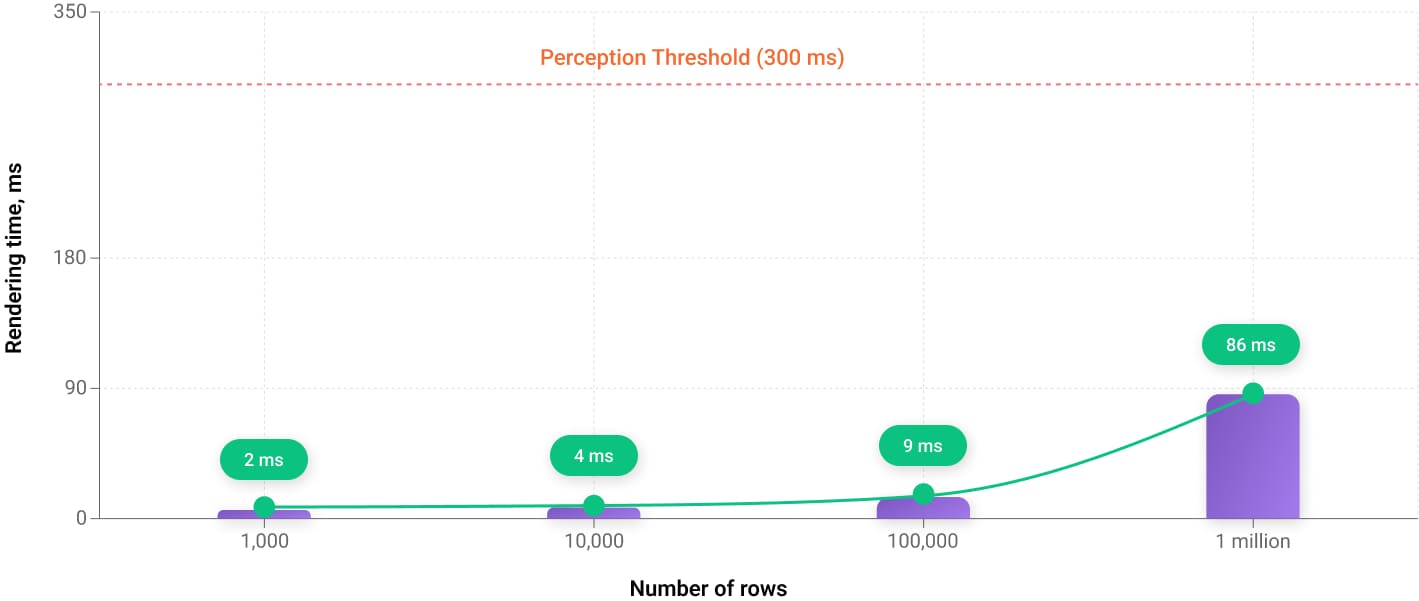
What makes Webix unique is that its rendering speed remains consistently high regardless of the number of rows.
Below, you can see a demo that lets you test how fast Webix Grid is – just press the corresponding button to see the actual speed at which it renders 1,000, 10,000, or even 1 million records.
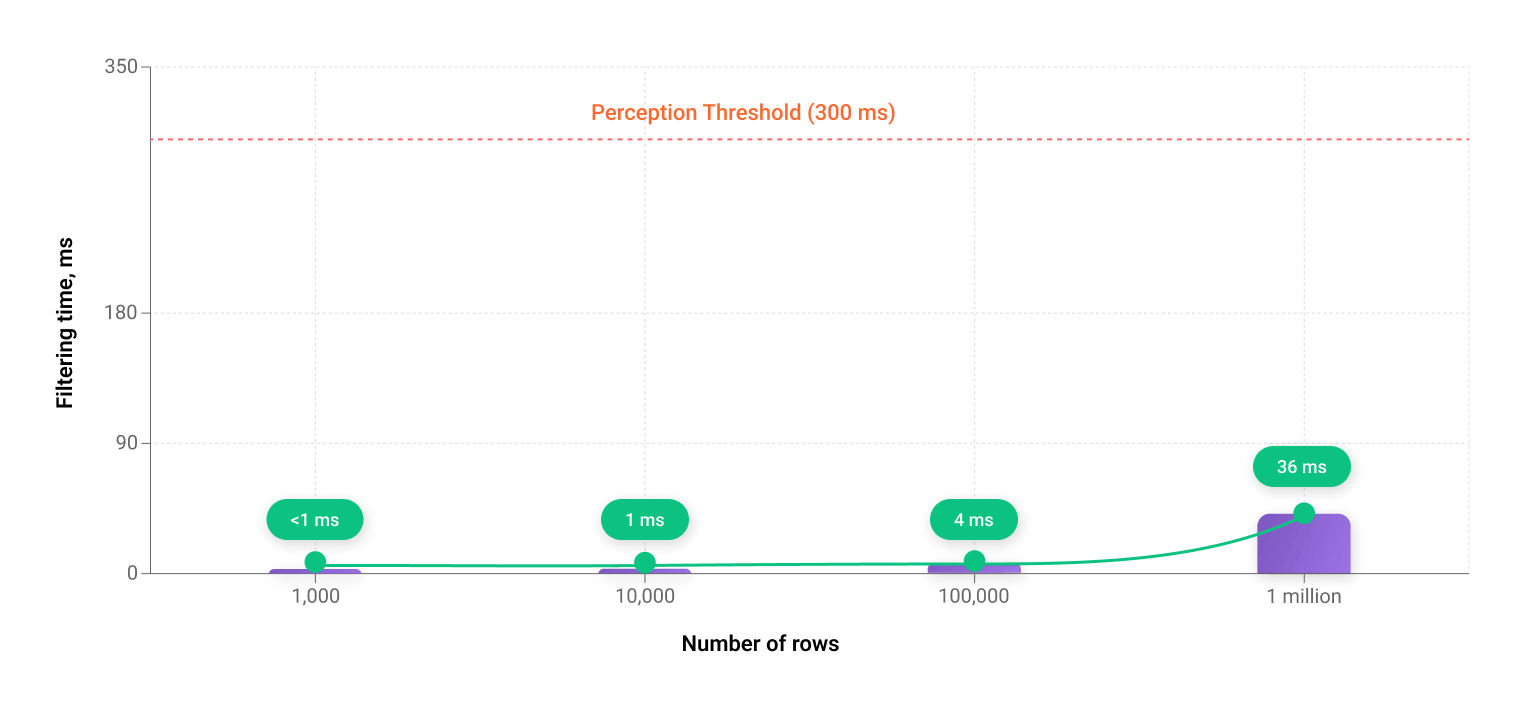
You can also refer to the chart below for a clear visual understanding of how the rendering speed depends on the number of rows in the table. The results you get may differ slightly from mine depending on the device you use, though they will be roughly similar. And this won’t change the overall picture – records are rendered blazing fast no matter how many of them your table contains. The speed only goes down slightly with extremely large datasets. Anyway, all operations complete well below the 300 ms threshold at which users begin to consciously perceive a delay. So the grid feels instantaneous even with a million records.
|
Number of rows |
1,000 rows |
10,000 rows |
100,000 rows |
1 million rows |
|
Actual rendering times |
2 ms |
4 ms |
9 ms |
86 ms |
Lazy Rendering Strategy and DOM Size Stability
The figures we got from the tests in the previous sections raise a question: how does Webix Grid maintain such stable, high rendering performance? And this brings us to the first architectural feature I’d like to highlight today – lazy rendering (aka dynamic rendering) strategy. What does that mean in simple terms? Webix always renders and inserts into the DOM only the rows that are currently visible, no matter how you choose to navigate the data – by scrolling or using pagination. And this leads us to a straightforward formula: the same number of elements to draw means the same, or nearly the same, level of performance.
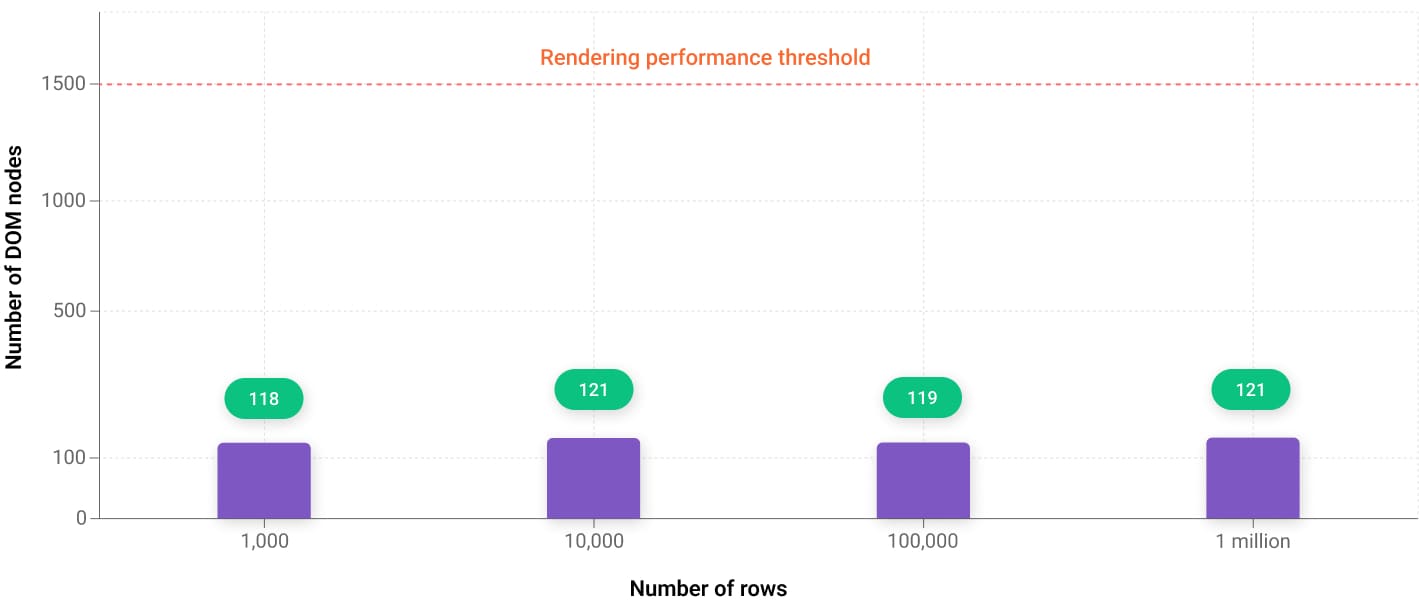
In the chart below, you can see the DOM size measured immediately after rendering. I used a simple way to count the DOM elements: running document.querySelectorAll(“*”).length in the DevTools Console. This is what I get as a result – even when the dataset jumps from 1,000 to 1 million rows, the DOM size barely changes – just ± a few nodes. That’s exactly how a well-optimized lazy-rendering system should behave.
|
Number of rows |
1,000 rows |
10,000 rows |
100,000 rows |
1 million rows |
|
Number of DOM nodes |
118 nodes |
121 nodes |
119 nodes |
121 nodes |
The number of DOM nodes is the total count of elements, text blocks, comments, and attributes that the browser creates in memory based on the HTML code. A high number of nodes indicates a complex structure, which slows down rendering, increases memory consumption, and reduces overall page performance. Generally browsers handle up to 1,500 nodes without issues.
Scrolling Performance and FPS Stability
Well, we have checked the drawing speed – it’s steadily high, so here, everything is perfectly fine. But it’s only part of the story. What happens when we start scrolling a table with a million records – will we have delays, frame drops, or choppy movement?
To find out how things are going with scrolling, I recorded fast up‑and‑down movement in the grid using Chrome DevTools (Performance tab) and checked the FPS indicators. Below, you can see a screenshot of what I got. Each vertical bar in the graph represents a single frame, and you can see that the bars are distributed evenly. This means that although I was scrolling through a large dataset, the browser continued to produce frames at a stable pace. From the user’s perspective, it feels like a responsive interface with smooth, uninterrupted scrolling. So here, Webix Grid earns another point – scrolling works great, with no glitches.
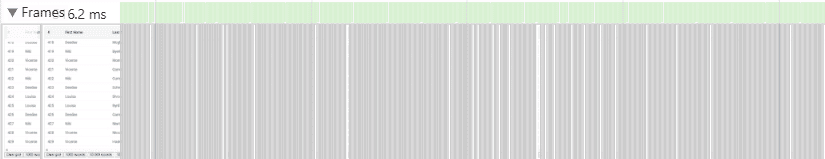
Webix Grid vertical scroll performance in Chrome DevTools
Efficient Rendering with a Large Number of Columns
Up to this point, we’ve examined how Webix Grid behaves when rendering rows. Now, let’s take a look at how it handles columns. Here we come to the second architectural solution I would like to mention – lazy drawing for columns, which allows the grid to render large numbers of them without any performance or scrolling issues.
Column Rendering Benchmarks (10 to 1,000 Columns)
We will test the grid using the same metrics as we did for rows and take a look at the results. We are not going to render millions of columns – thousands are more than enough to cover nearly all real-world scenarios. I also want to particularly stress that drawing thousands of columns is considered a heavy scenario for data grids, and it is not something that is achieved easily by all the table components represented on the market – this is more like an extra‑challenge task.
Go ahead and press the 10, 100, 500, and 1,000 buttons in the table below to check performance on your device.
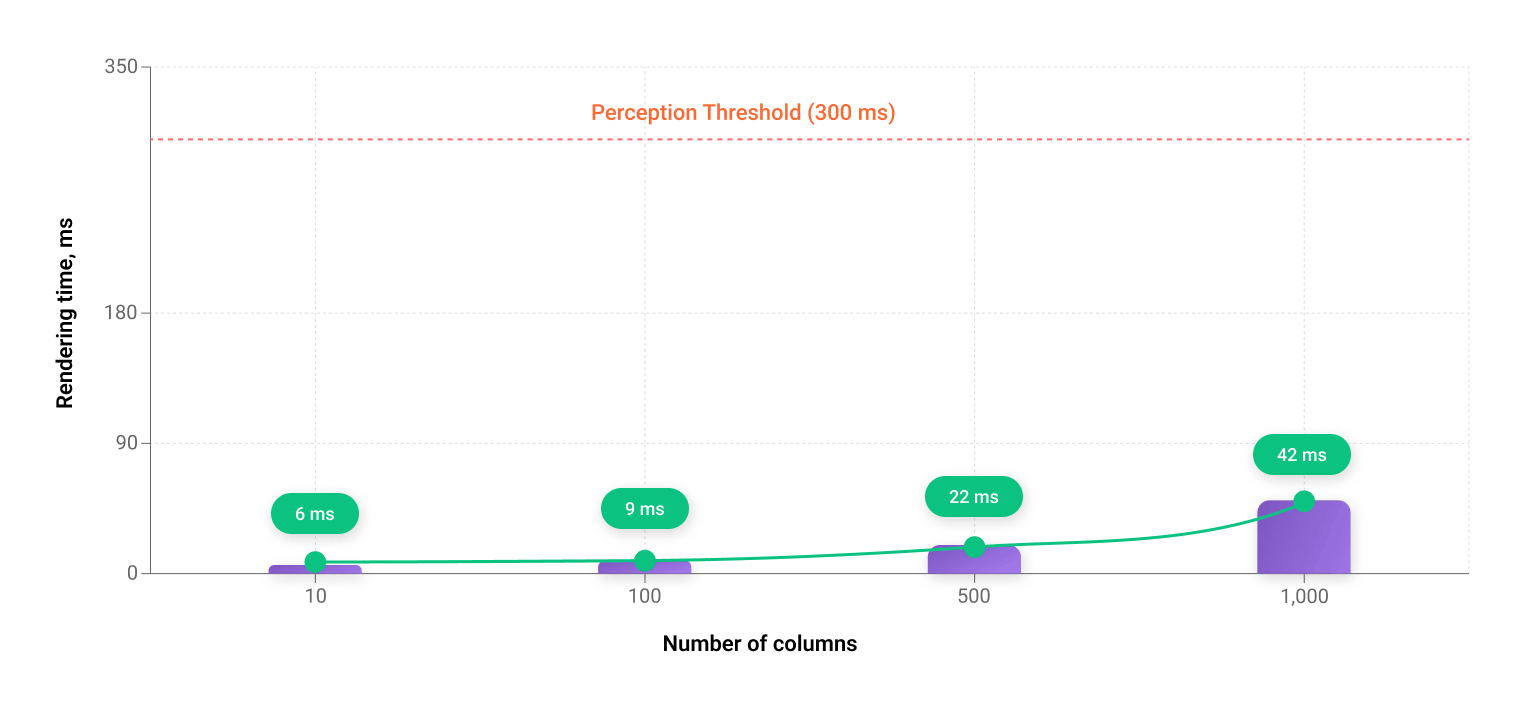
You can also check out the chart below that visualizes how performance changes with the number of columns.
|
Number of columns |
10 columns |
100 columns |
500 columns |
1 000 columns |
|
Actual rendering times |
6 ms |
9 ms |
22 ms |
42 ms |
And refer to the FPS screenshot I made on my laptop to help you assess the grid’s efficiency.
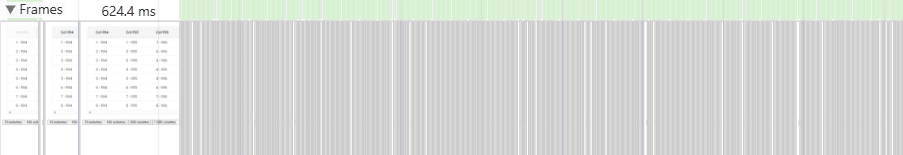
Webix Grid horizontal scroll performance in Chrome DevTools
The numbers we received show that column rendering is highly optimized – no lags while drawing or scrolling. The proof that Webix Grid does the heavy lifting with ease.
Inline Data Operations: Sorting and Filtering Performance
Now that we are done with the basic assessments, we need to test a few more very important things to make sure the grid does its job well. In this section of the article, we are going to look at how Webix Grid deals with filtering and sorting. I advise you to always pay attention to these indicators and not stop at checking only rendering speed or scrolling – in practice, a grid may show good rendering performance but start lagging when you try, for example, to filter massive data.
Sorting Performance Benchmark
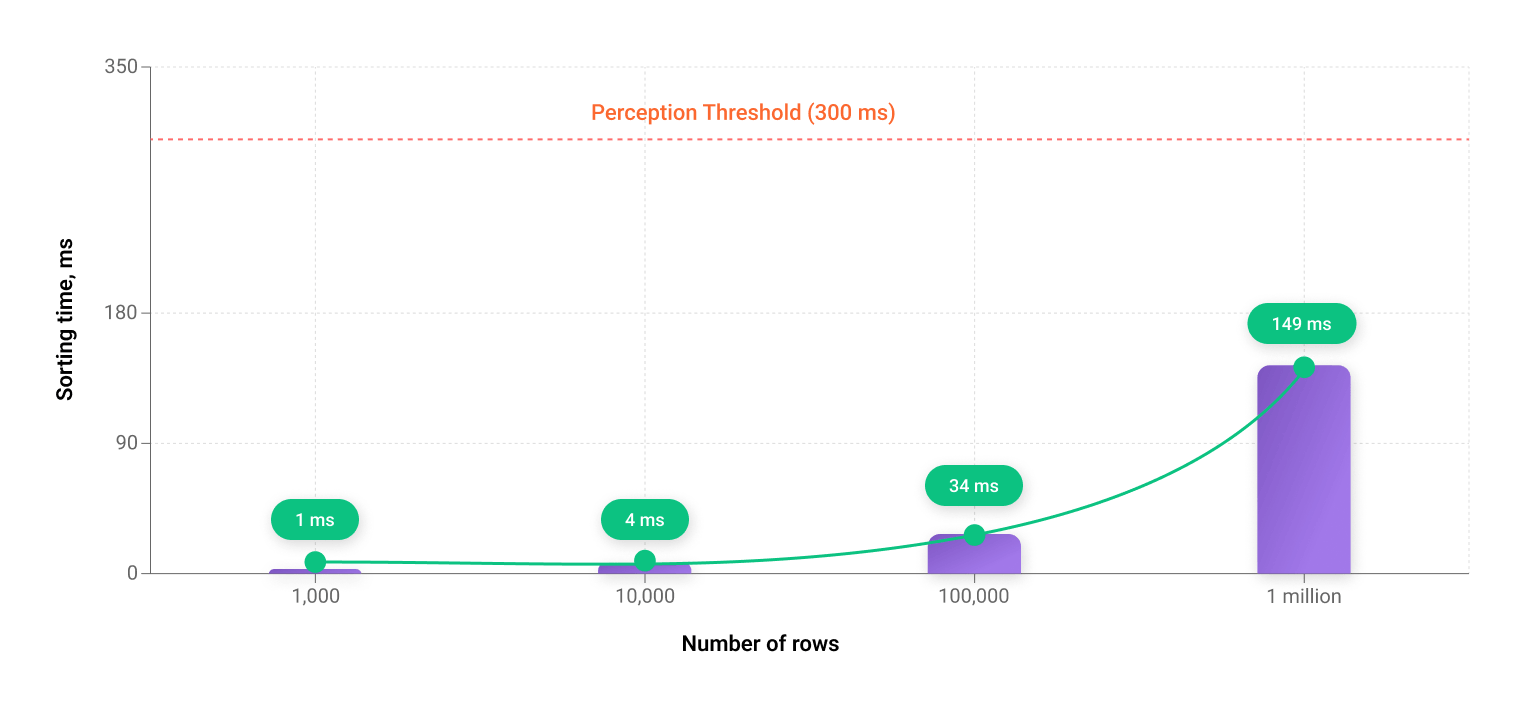
Let’s continue our research by measuring how long the grid’s internal sorting algorithm takes to process a dataset. I made it simple: used Webix’s onBeforeSort and onAfterSort events and captured two timestamps with performance.now() – the start and end of sorting – and then computed the difference between them. Below, you can see the trend. Sorting is instant with thousands of rows and is barely perceptible to the observer even with a million.
Press one of the buttons below the table to load the rows and then click on the column headers to check performance on your device.
You can find the sorting visualization below.
|
Number of rows |
1,000 rows |
10,000 rows |
100,000 rows |
1 million rows |
|
Actual sorting times |
1 ms |
4 ms |
34 ms |
149 ms |
Filtering Performance Benchmark
To measure filtering we will apply a different approach. Instead of relying on header filters, we will trigger filtering programmatically. When the user presses one of the buttons to load a specific number of rows, they will also fire a custom function for the Income column. This function contains Grid’s filter() API method and a filtering rule that keeps only rows where the income value is greater than 1000. This way we get accurate numbers that reflect raw performance.
Now, you can try it yourself. Press one of the buttons below the grid and you’ll see how quickly it filters the Income column.
And once again, I visualized the metrics to make them easier for you to grasp.
|
Number of rows |
1,000 rows |
10,000 rows |
100,000 rows |
1 million rows |
|
Actual filtering times |
less than 1 ms |
1 ms |
4 ms |
36 ms |
The filtering benchmark results speak for themselves – here we also observe a high data-processing speed.
Localized Updates During Inline Editing
We have finally come up to one more crucial thing I want to draw your attention to – inline editing behavior. What happens when we decide to edit a single cell? Does Webix Grid redraw the whole table or has a smarter approach to handling edits?
Actually, Webix Grid has an internal mechanism that tracks updates and then passes the information about the changes to its render() method (the row ID, what was updated, and in which mode). As a result, only the row affected by the changes is re‑rendered. This means the DOM is mutated in a very targeted way, touching the smallest possible number of DOM elements, regardless of how large the dataset is.
This architectural pattern directly improves inline editing latency – i.e., how long it takes for the UI to react after we make edits inside the grid.
In fact, the update time is always nearly the same, as we deal with a narrowly-scoped set of elements we modify.
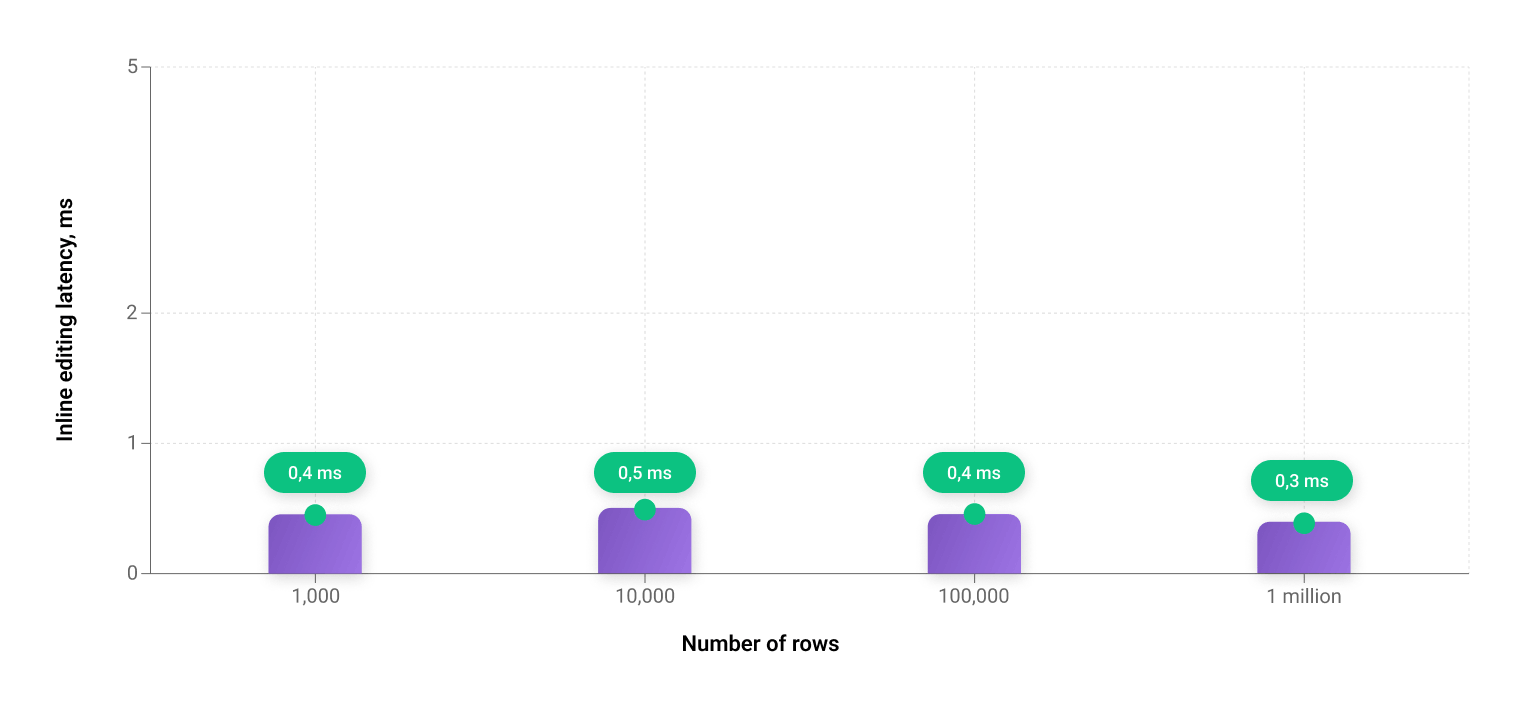
To show you what I am talking about I measured this performance metric as well. The indicator itself is somewhat intricate – it normally fluctuates as it is influenced by multiple factors of the environment in which the grid runs. But I wanted to demonstrate the trend, which stays the same – instant changes and predictable user-perceived performance at scale. Here are the numbers I got: as you can see the performance is stable and far beyond any perception threshold (the edits take less than 1 ms).
|
Number of rows |
1,000 rows |
10,000 rows |
100,000 rows |
1 million rows |
|
Inline editing latency (ms) |
0.4 ms |
0.5 ms |
0.4 ms |
0.3 ms |
Feel free to make your own measurements: edit any cell in the grid below and press Enter to check the latency indicator on your device.
Performance Summary: Stability Under Extreme Data Loads
Webix Grid consistently maintains high efficiency across all key scenarios: rendering large datasets, intensive scrolling, sorting, filtering and editing operations. Even when working with millions of rows, the UI remains responsive and smooth, without noticeable delays or FPS drops. This way, we see that Webix Grid is a very strong component for data-intensive applications in terms of speed, predictability, and stability under load.
Architecture-Level Control and Programmatic API
One more thing I want to point out is that high grid performance really matters, but it must go hand in hand with proper control of the component at the application level – and no other way. Only then does all of this have practical value in real-world development. I won’t go deep into this topic here, but I will say that with Webix you don’t need to worry about it. Webix Grid provides a structured API and an event-driven model that let you manage data, state, and behavior effectively.
The component supports:
- handling user events (editing, sorting, selection, scrolling);
- controlled update and recalculation operations;
- programmatic modification to data and column configuration;
- state synchronization with the server.
Common operations such as updateItem(), refresh(), or attachEvent() allow developers to shape Webix Grid behavior with high precision. Thus, Webix Grid proves to be fully compliant with modern expectations for developer-level control and configurability.
Performance & Scalability in Real-World Scenarios
After testing Webix Grid’s performance, evaluating its data-handling efficiency, and briefly reviewing its API, let’s look at real-world examples that show the component in all its strength and illustrate the kinds of complex applications where it can be used.
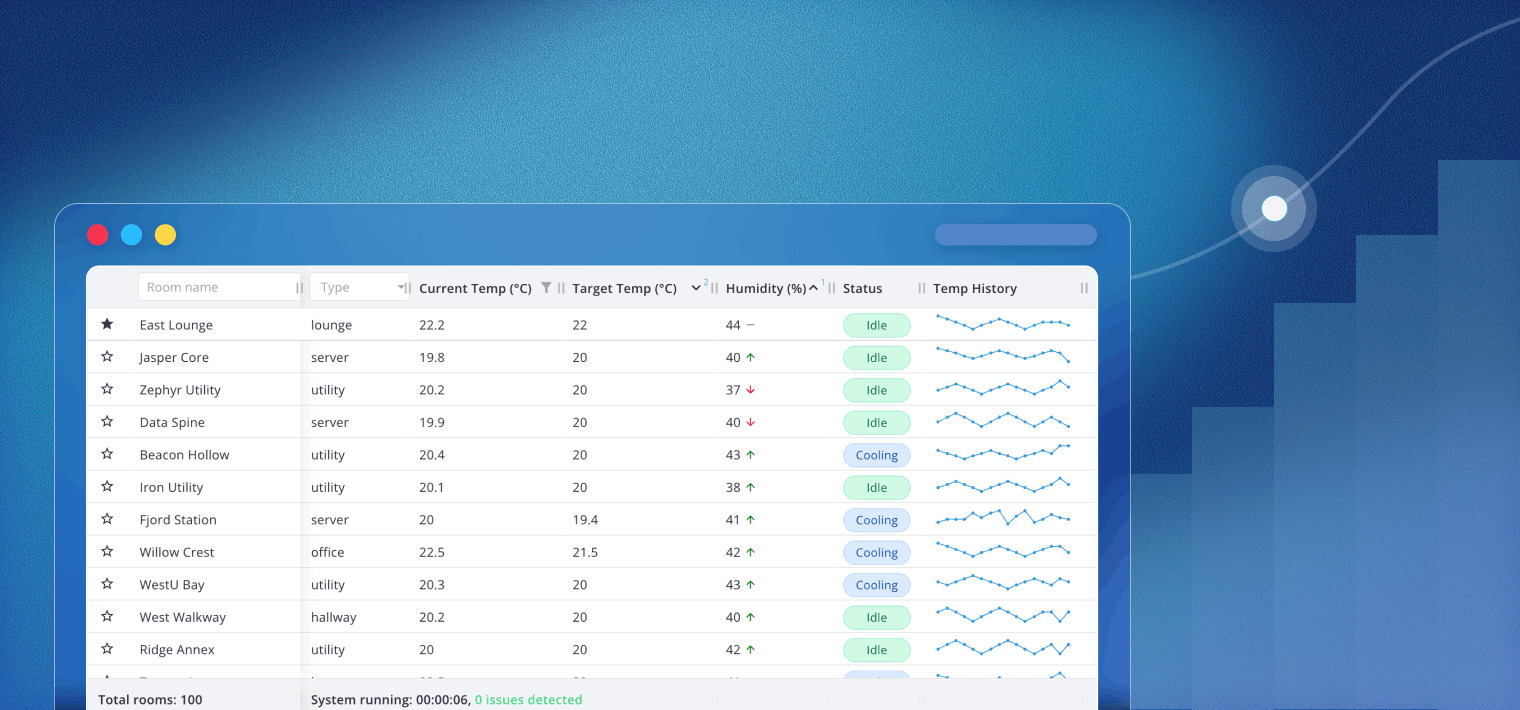
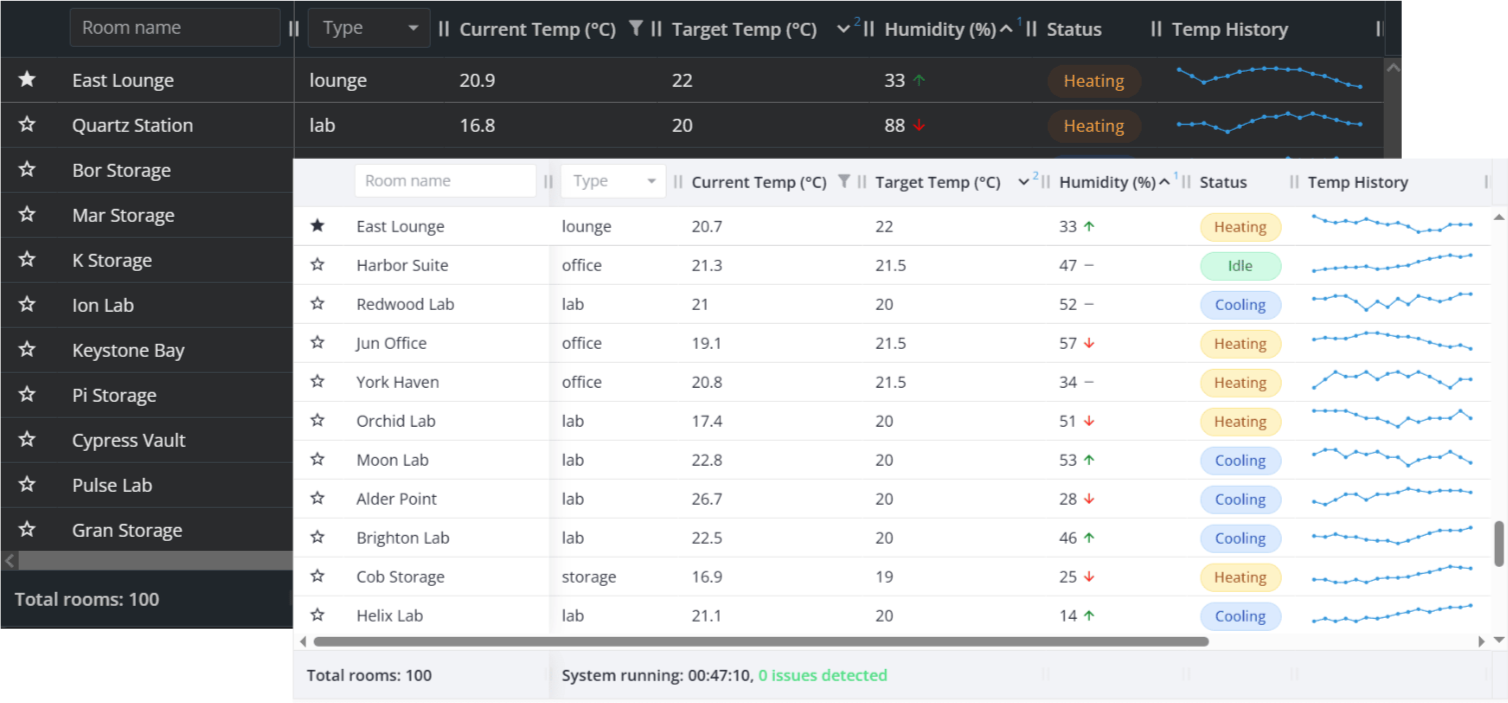
Real-World Example: Monitoring Dashboard
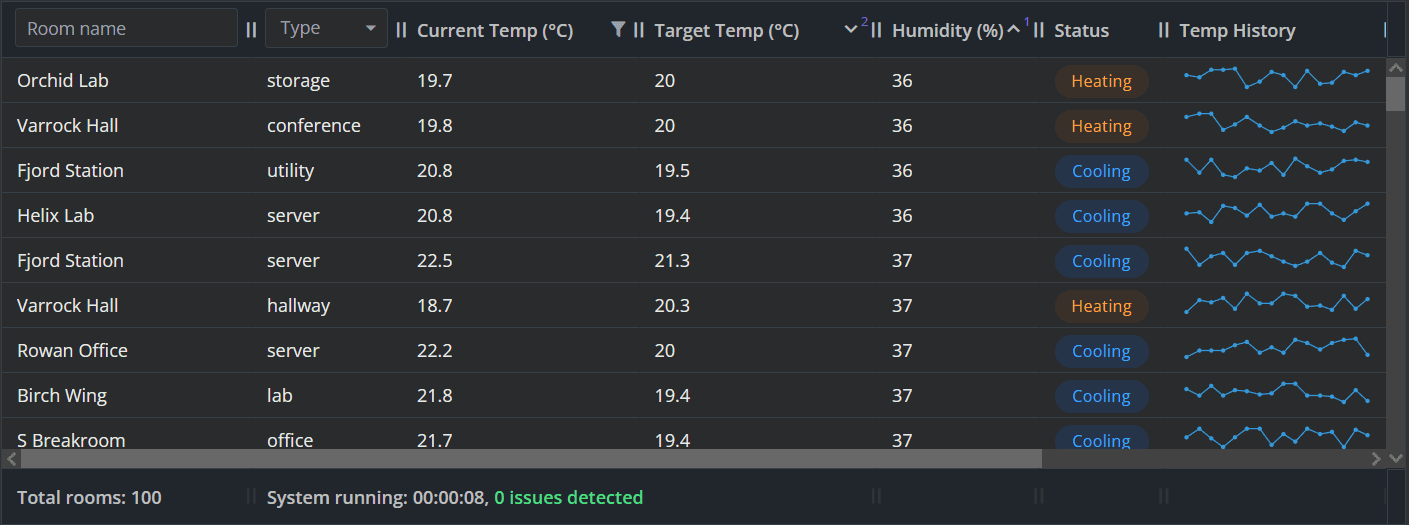
Below is a monitoring dashboard that tracks temperature, humidity, and system status across multiple rooms. The grid combines text and numeric values along with Sparklines (small temperature-history charts) that are designed to support real-time updates. This example demonstrates how Webix Grid handles mixed data types and dynamic content while maintaining the responsiveness shown in the performance tests above.
Let’s now explore the practical capabilities that Webix Grid brings to enterprise-grade systems:
- Smooth virtual scrolling at any scale
Effortless navigation across hundreds, thousands and millions of rooms with stable FPS, even as temperature and humidity values fluctuate and need to be updated continuously.
- Real‑time data updates
The grid refreshes current temperature, humidity, and status fields in place, reflecting live sensor data.
- Support for mixed data types
As you can see in the images and GIFs, text, numeric values, icons, and mini-charts coexist in a single table without any rendering delays.
- Inline visualizations inside cells
Temperature-history Sparklines (micro-charts) show trends directly in the table, reducing the need for external chart components.
- Instant sorting & filtering
Webix Grid processes sorting and filtering operations with near-zero latency, maintaining smooth interaction even with millions of rows.
- Drag-and-drop
Built-in DnD support lets users rearrange rows and columns directly inside the grid, enabling fast data restructuring.
- Custom styling & theming options
The grid’s appearance can be tailored through CSS, custom templates, and built-in themes. This makes it easy to match the visual style of enterprise dashboards, highlight critical metrics, or adapt the UI for dark mode, high‑contrast layouts, or brand‑specific color schemes.
We’ve just reviewed the key functionality that makes Webix Grid a strong choice for environmental monitoring dashboards, industrial control panels, or BI-style admin interfaces.
Now, you can go to the page with the interactive demo, generate data and check the performance metrics in real time to experience Webix Grid for yourself.
Conclusion
Webix Grid demonstrates how a well-engineered data component can stay fast, predictable, and easy to work with even under demanding, real-world conditions. Throughout this review, we’ve seen how its architecture handles massive datasets, real-time updates, mixed data types, and complex interactions without compromising responsiveness. The combination of lightweight rendering, stable FPS, and efficient data‑processing algorithms makes it a reliable foundation for applications that depend on accurate, high‑frequency data.
Try It Yourself: Docs, Demos, and Free Trial
Want to dive in and explore Webix Grid beyond the basic example, here are the quickest ways to do that:
- Documentation – check API references, configuration examples and styling guides for building advanced tables.
- Snippet Gallery – test interactive samples showcasing sorting, filtering, editing, drag‑and‑drop, sparklines, and other features in action.
- Free Trial – try Webix Grid Pro with all the enterprise-grade features and free technical support during the 30-days trial period.