Today, we’d like to walk you through a real-world use case: transforming data from Webix SpreadSheet into Pivot Table. You’ll learn how to integrate two advanced widgets to implement more complex scenarios in your application.
Why combine Spreadsheet and Pivot? What practical tasks can we solve by using them together? Here are some of the most common examples:
- raw data editing (e.g., monthly sales, inventory stock levels), followed by business trend analysis;
- live data aggregation for real-time market tracking or industrial monitoring;
- KPI tracking and financial modeling, where data is first preprocessed in Spreadsheet and then aggregated in Pivot;
- assessment systems that support data entry and generate analytical summaries within a single interface.
Now, let’s move on to the widgets we are going to work with.
Meet the Widgets: SpreadSheet and Pivot Overview
SpreadSheet is a complex solution for working with data in a tabular format. It allows users to create tables, sort, filter, edit and manipulate data with the help of formulas and math functions. In fact, the widget enables the implementation of Excel-like functionality in your business app.
Pivot is a tool designed primarily for aggregating, analyzing, and displaying large datasets in the form of tables and reports. It also offers advanced visualization options, including charts for presenting your data.
In this tutorial, we’ll demonstrate you how to leverage the strengths of both tools – first by loading data into SpreadSheet, which supports editing and complex calculations, and then by presenting the dataset in Pivot Table.
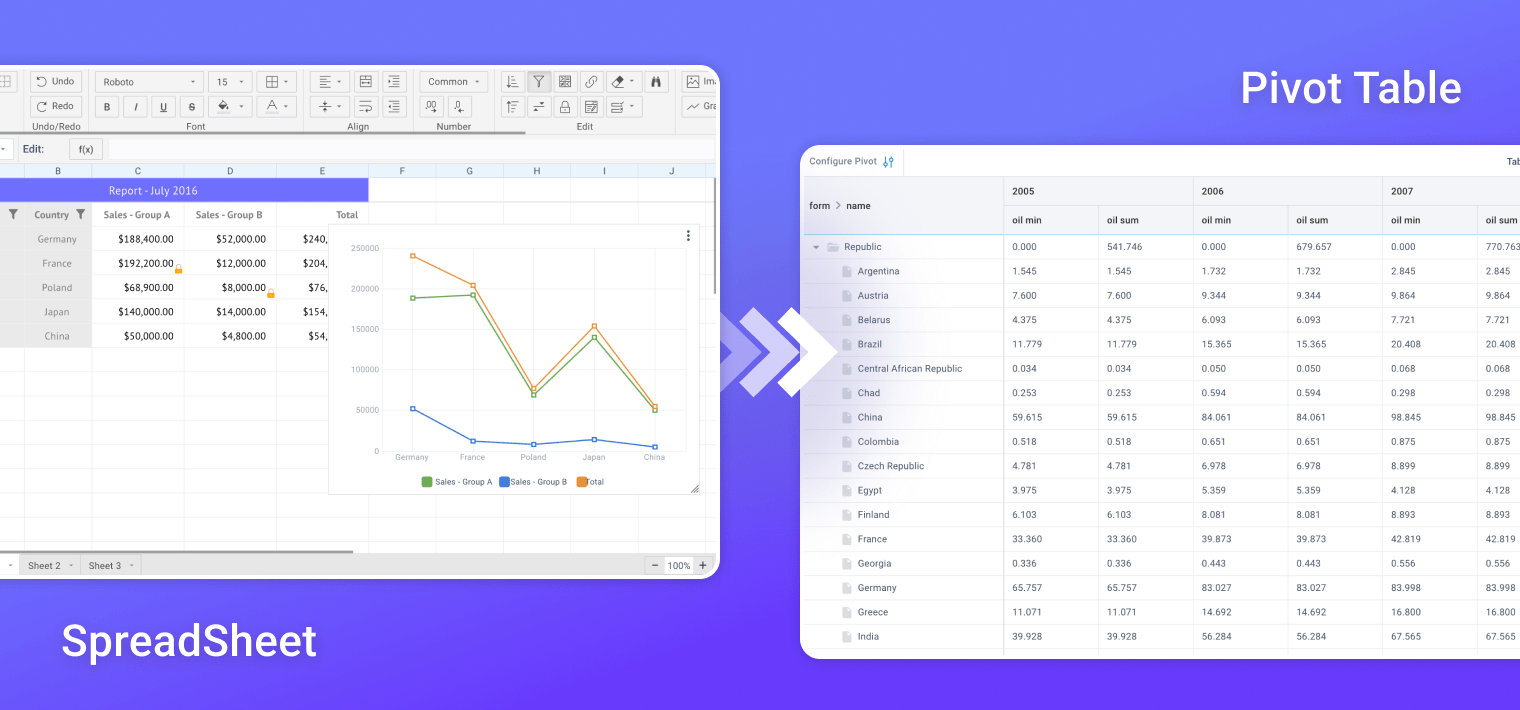
Let’s take a look at what we’re going to build:
This is how it works from the end user’s perspective: the user selects cells in the SpreadSheet datatable, clicks the “SUMMARY TABLE” button, and generates Pivot Table based on the selected dataset.
Now, let’s bring it to life and explore the implementation details.
Step 1: Initializing Webix Spreadsheet
We’ll start by initializing SpreadSheet with the predefined dataset in JSON format. You can view the sample data here at n:point. To load data into the widget we will assign a link to its url property.
At this point we will also place a button between the toolbar and the workspace of SpreadSheet with the help of the subbar property. A bit later we’ll implement the logic that will be triggered when the button is clicked. Here is the code we are going to start with:
view:"spreadsheet",
url: "https://api.npoint.io/8810a0b031cff6cc9c0a",,
subbar:{
view:"button",
label:"SUMMARY TABLE",
css:"webix_ssheet_toolbar",
click: () => {},
}
});
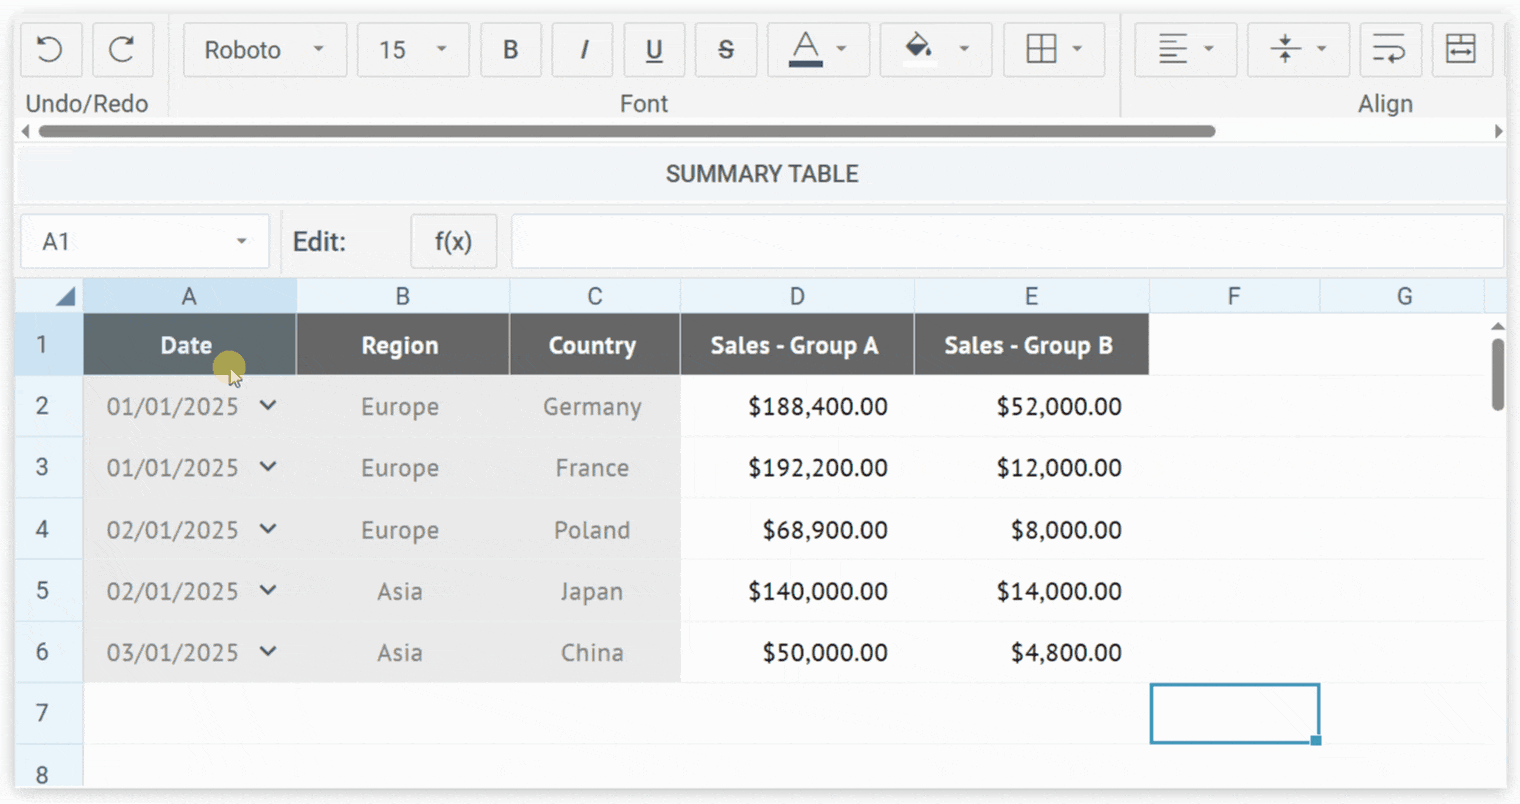
And this is the visual representation:
Step 2: Handling Button Click
Fetching and Validating the Selected Area
When the ‘SUMMARY TABLE’ button is pressed, the first thing we do is initialize the pivotData array to hold the Pivot data. You can check an example of a typical dataset for Pivot here. Then, we retrieve the selected area object using the getSelectArea method and assign it to the selected variable:
const selected = spreadsheet.$$("cells").getSelectArea();
Pivot Table requires at least two rows from our sheet – the values of the first one serve as field names and all the rest as data records. Therefore, we need to verify that a selection exists and the selected area contains more than one record. If not, we’ll throw errors with the help of the custom pivotGenerationError function:
if(selected){
if(selected.end.row == selected.start.row)
return pivotGenerationError("2 or more rows of data are required.");
}else pivotGenerationError("No cells selected.");
function pivotGenerationError(text){
webix.alert({
title: "Unable to generate pivot table",
text: text,
type:"alert-warning"
});
}
Serializing Spreadsheet Data
At this stage, we serialize SpreadSheet data for further processing. Note that we need to set the math parameter to false to prevent the serialization of mathematical formulas – that is, the data is extracted without them:
Preparing Structures
Let’s build a configuration that Pivot will recognize. We need to define the fields array to store the metadata of each column: id, type, and value (the column header). We will later populate this array with the help of the addField function, which will be called for each column header:
Another important step is to define the structure variable, which determines how Pivot Table is organized by rows and values:
Reading Header and Data Rows
We need to iterate over the selected rows and columns to retrieve their values. For the first (header) row, we use the addField function to define fields, since the values in this row are treated as field names for the resulting Pivot Table. If any field name is missing, the pivotGenerationError function is triggered. All the remaining rows are converted into data objects keyed by the field names assigned to each column:
const row = {};
for(let c = selected.start.column; c <= selected.end.column; c++){
const value = spreadsheet.getCellValue(r, c, false);
if(r == selected.start.row){
if(value)
addField(serialized, fields, structure, r, c, value);
else
return pivotGenerationError("An empty cell cannot be used as a field name.");
}
else
row[fields[c-selected.start.column].id] = value;
}
if(r != selected.start.row)
pivotData.push(row);
}
The addField function analyzes the type of data found in the row (date/string/number), assigns a unique id using webix.uid(), adds the field configuration to fields, and then updates the Pivot structure:
const nextRowItem = serialized.data.find(item => item[0] == row+1 && item[1] == col);
const type = nextRowItem && nextRowItem[4] != "string" ? nextRowItem[4] : "text";
const id = "field"+webix.uid();
fields.push({
id, type, value,
predicate: type == "date" ? "date" : null,
prepare: type == "date" ? getJsDateFromExcel : null
});
if(type == "number")
structure.values.push({name: id, operation: "sum"});
else
structure.rows.push(id);
}
SpreadSheet, just like Excel, stores dates as serial numbers, so we need to convert them into JavaScript Date objects with the help of the getJsDateFromExcel function:
const date = new Date(Math.round((excelDate - 25569) * 86400 * 1000));
return new Date(date.getTime() + date.getTimezoneOffset() * 60000);
}
Generating Pivot Table
At this point we need to pass the processed data, structure, and fields metadata to the loadNewPivotData function, which populates and renders the Pivot Table, and then display pivotWindow (we’ll initialize it in the final part of the tutorial):
pivotWindow.show();
The loadNewPivotData function clears the existing Pivot data, injects the updated field definitions and raw data into the Pivot and then sets the Pivot structure:
const pivot = pivotWindow.getBody();
pivot.clearAll();
const config = pivot.$app.config;
config.fields = fields;
config.data = data; // custom property
return pivot.getService("local").getData(true).then(() => {
pivot.setStructure(structure);
});
}
Step 4: Customizing Pivot Backend Service to Use the Generated Data
Now we need to define a custom MyBackend class to fetch Pivot data based on the app’s current configuration:
data() {
return webix.promise.resolve(this.app.config.data || []);
}
}
Step 5: Initializing Pivot Window
Finally, we create a fullscreen Window view with Pivot Table:
view:"window",
head:"SUMMARY TABLE",
close:true,
fullscreen:true,
body:{
view:"pivot",
predicates: {
date: webix.Date.dateToStr(webix.i18n.dateFormat),
},
override: new Map([[pivot.services.Backend, MyBackend]]),
}
});
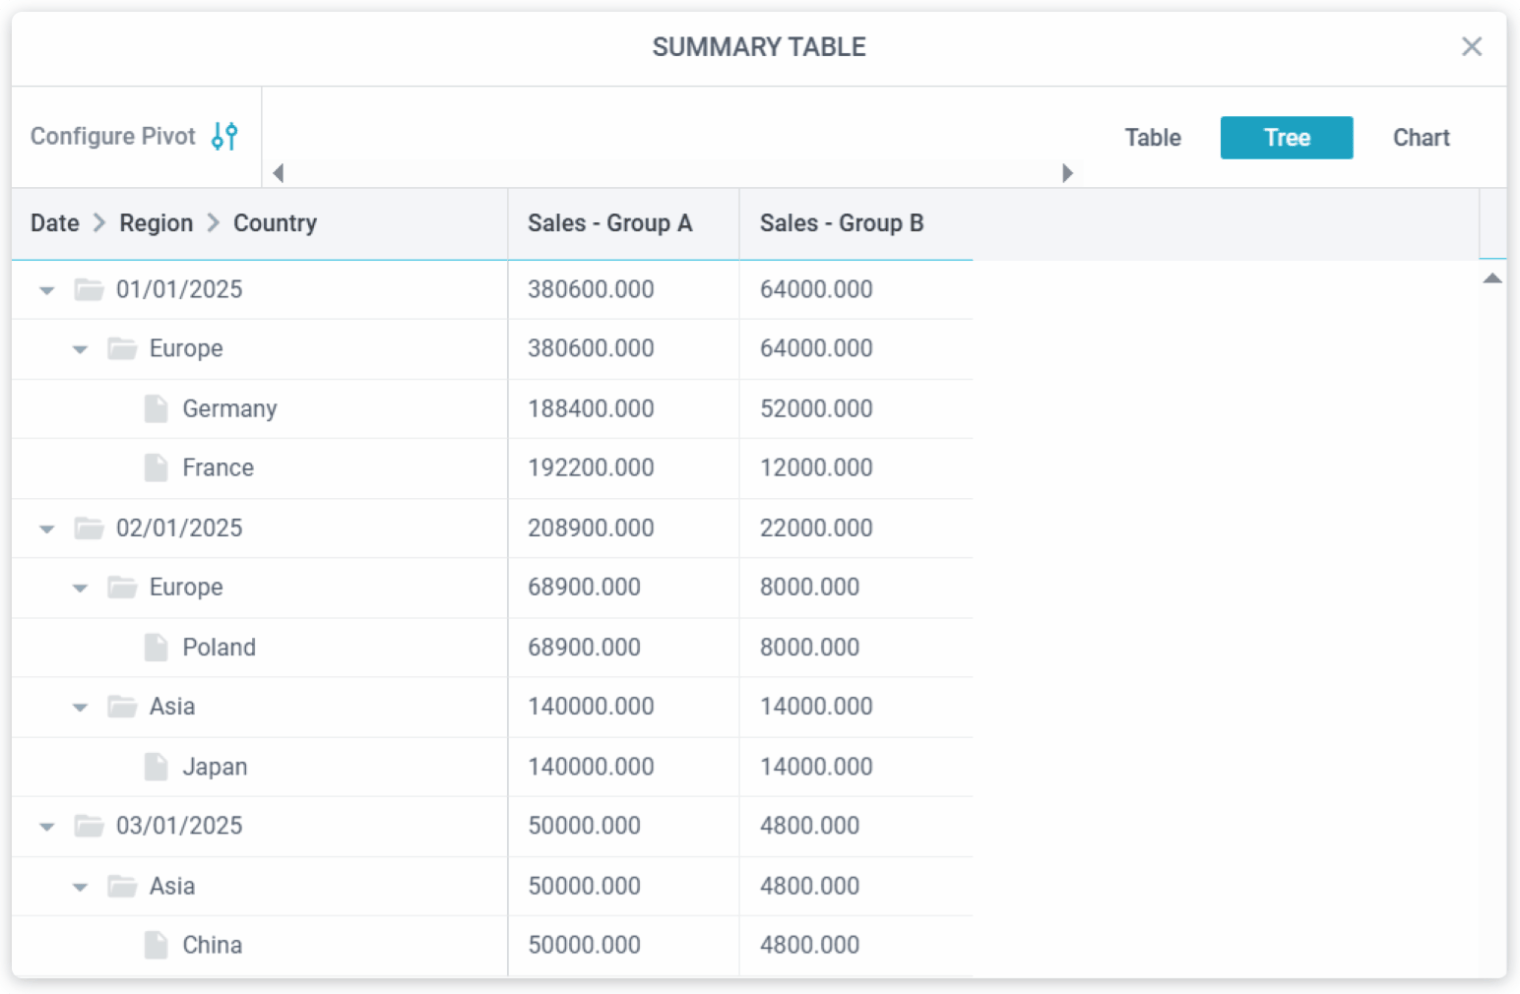
And that’s it – our Pivot Table now displays the data we selected:
View code >>
Conclusion
By integrating Webix SpreadSheet with Pivot, we’ve designed a robust solution that allows building summary tables from SpreadSheet data. We managed to improve user experience by fully leveraging the widgets’ capabilities, enabling app users to aggregate and visualize their data seamlessly. One more significant benefit we’ve gained is a more flexible and scalable data analysis system. With the Webix library, you can easily combine components to bring complex business logic to life. Just try it out – we believe the results will speak for themselves.
Helpful Guides
Follow these practical guides and check out code snippets to explore Webix SpreadSheet and Pivot – their basic configuration, the complete feature set and extended capabilities:
- Webix SpreadSheet: Overview, User Guide, Snippet Gallery
- Webix Pivot: Overview, User Guide, Snippet Gallery