We all like to use simple apps where an interface is easy and straight. Creating such apps is a breeze, just put some HTML tags, add a UI framework of your choice, something like Bootstrap, for example, and the app is ready.
In real every-day development, things are bit different. It is common for a business app to work with complex data, that requires some advanced UI to represent it. A nested data is one of such use-cases. There is no a ready to use solution to show such kind of data in raw HTML or in Bootstrap. For such kind of task, you need a more powerful tool. Something like Webix UI.
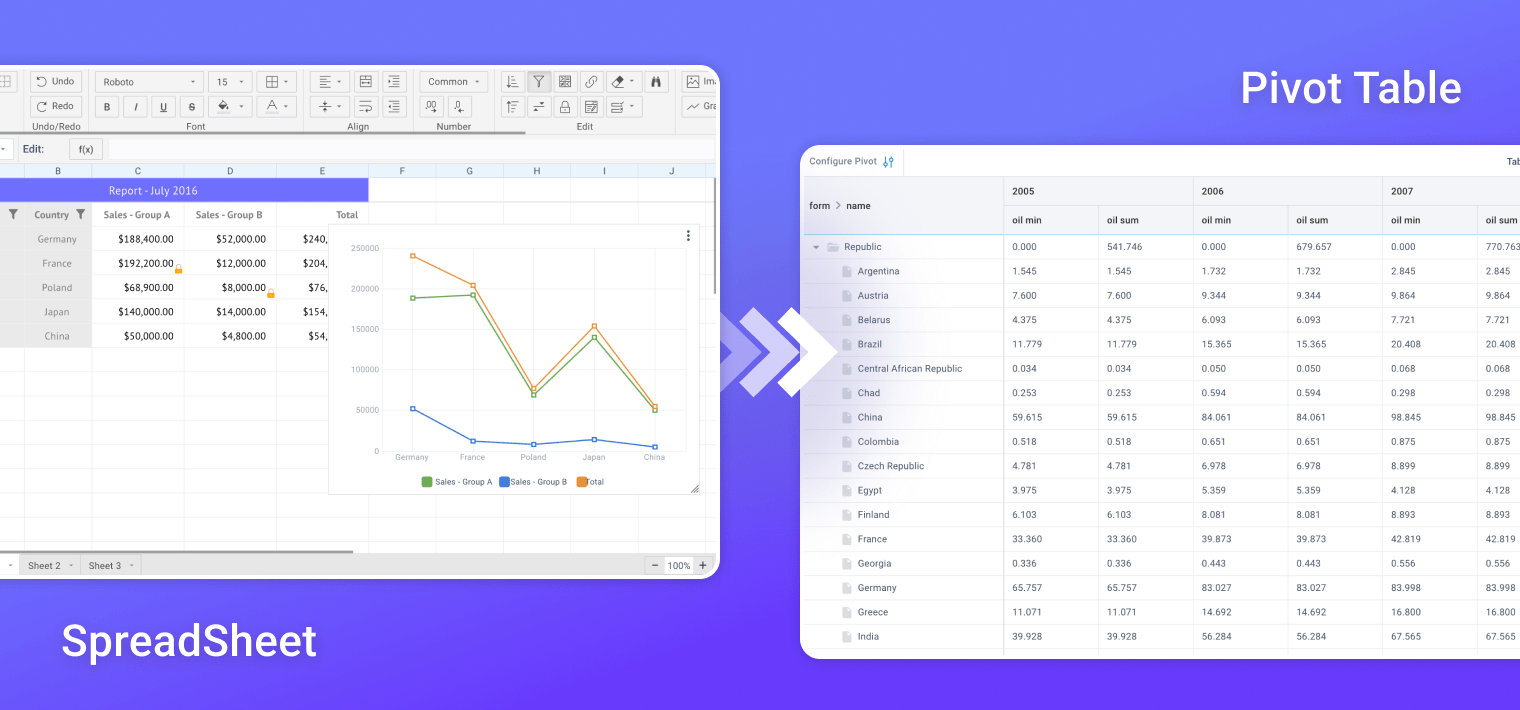
Webix has also developed an in-house solution for managing large volumes of aggregated data in business web apps: the JavaScript Pivot Table. This tool analyzes and displays data in a tabular format.
Tree
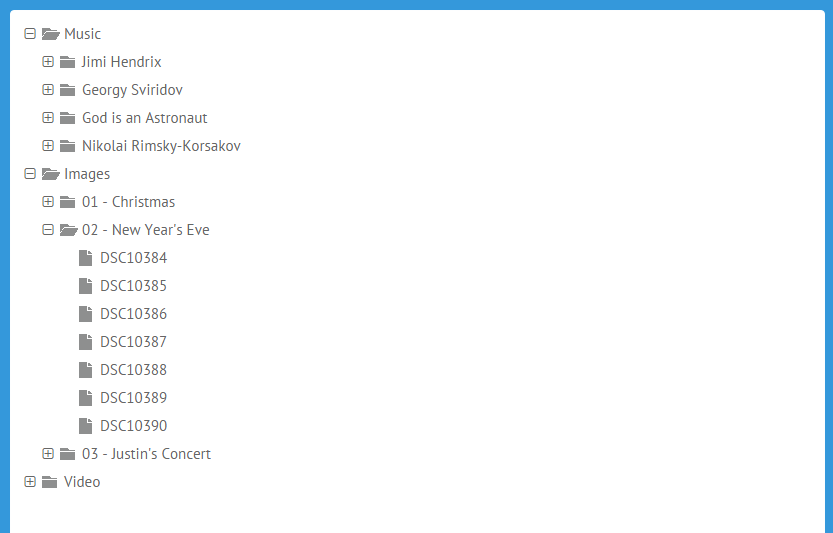
The simplest widget that can be used to show nested data is a Tree. It is common UI element for desktop apps, but still rare in web apps. Webix Tree has all common functionality of tree widget; it allows to represent the hierarchical data as a tree, where branches can be expanded or collapsed. Additionally, Webix Tree is really fast. It renders thousands of items in less than 1 second. And if that is not enough, you can utilize a dynamic loading feature to load data on demand.
view: "tree", data: nested_data
});

GroupList
GroupList is a sibling of the Tree. It shows nearly the same data but in a different way. This widget had become popular after rise of the mobile web. Screen size limitations of mobile devices and necessity to support un-precise touch actions was the reason or replacement a tree with grouplist in most mobile apps.
The API and format of data for GroupList are similar to API and data format of Tree, so you can change one view with another without affecting app’s logic too much.
view: "grouplist", data: nested_data
});

TreeTable
The tree is a good component, but it shows only one value per item. By using tree’s template you can put more info into each item, still it doesn’t suit for multi-column data. Here TreeTable comes to the rescue. It has all functionality of Tree, plus it can show multiple columns of data at once.
view: "treetable", columns:[
{ id:"id", header:"ID", width:40 },
{ id:"value", header:"Name", width:300,
template:"{common.treetable()}#value#"
},
{ id:"details", header:"Comments", fillspace:true },
],
data: nested_data
});

SubViews in DataTable
Now, thanks to TreeTable we have a solution, that allows to show nested data with a lot of data columns. All is perfect, except one thing. In case of TreeTable, each level of the data is the same. In real life apps, data can be different on each level ( we can have shops on top level, categories on the second level, and products on the third )
Fortunately, Webix UI has a solution. Starting from Webix 3.0, you can use SubViews in DataTable, which means you can define a different Table for each level of data. Check the next snippet:
view:"datatable",
subview:{
view:"datatable",
columns:[
{ id:"Outlet", sort:"string", fillspace:true },
{ id:"January" },
{ id:"February" },
{ id:"March" }
],
},
columns:[
{ id:"title", header:"Title", sort:"string",
template:"{common.subrow()} #title#", width:220 },
{ id:"employees", header:"Employees", fillspace:true }
]
});

As you can see,
the configuration of the master table includes the configuration of sub-table. And this configuration can be repeated as many times as necessary, the sub-table may include configuration of some other sub-table and so on.
All sub-tables works in the same way as the normal DataTable widget, so you can load, edit, save, filter data through the common API.
Adding one more dimension
There are no widgets for more complicated data.
But… you can alway create one. That is one more benefit of Webix UI usage. You have a set of building blocks at your hands, so when default widgets are not enough, it is easy to create a new widget on top of existing blocks.
Lets assume that in addition to the already complex data hierarchy, we have a second set of nested data ( each shop has a list of categories, and a list of employees ). To solve this UI puzzle, we can add a button into the DataTable and create a separate popup that will be used to show employees.

Above solution is just one of possibilities; there are other ways to include a lot of data into a limited screen space.
Where is a limit?
There is no limit. Webix UI gives you tools to visualize data of any complexity. As you can see, Webix UI has a lot of ways to visualize nested datasets, from simple tree to complex hierarchical views.
It doesn’t mean that you need to use such a complex UI for everyday tasks. If you need to create a simple page, you can use any tool of choice. But if you need to create something more complex, try to use a Webix first, and you will not regret.


