Webix 11.3 is here bursting with updates! In this release, we introduced Core enhancements, exciting new features in Rich Text Editor, as well as extensive improvements across the library. Optimized rendering for touch devices and smarter Colorboard in Core, Markdown support and customizable context menu in Rich Text Editor, and much more. Below, we’ll go through all the key upgrades in detail.
WEBIX BLOG
Best JavaScript Data Grid to Use in 2026
Webix 11.2: Column Resize on Touch Devices in Grid, Dynamic Array Methods in SpreadSheet, Auto-Scrolling to Date in Gantt and more
Let’s welcome Webix 11.2! We are happy to share with you a fresh round of updates, inspired by modern development trends and insightful user feedback. This release brings core enhancements that improve Webix Grid usability, major updates to SpreadSheet, new functionality in Gantt, and refinements throughout the library. No need to wait – let’s move directly to exploring new features!
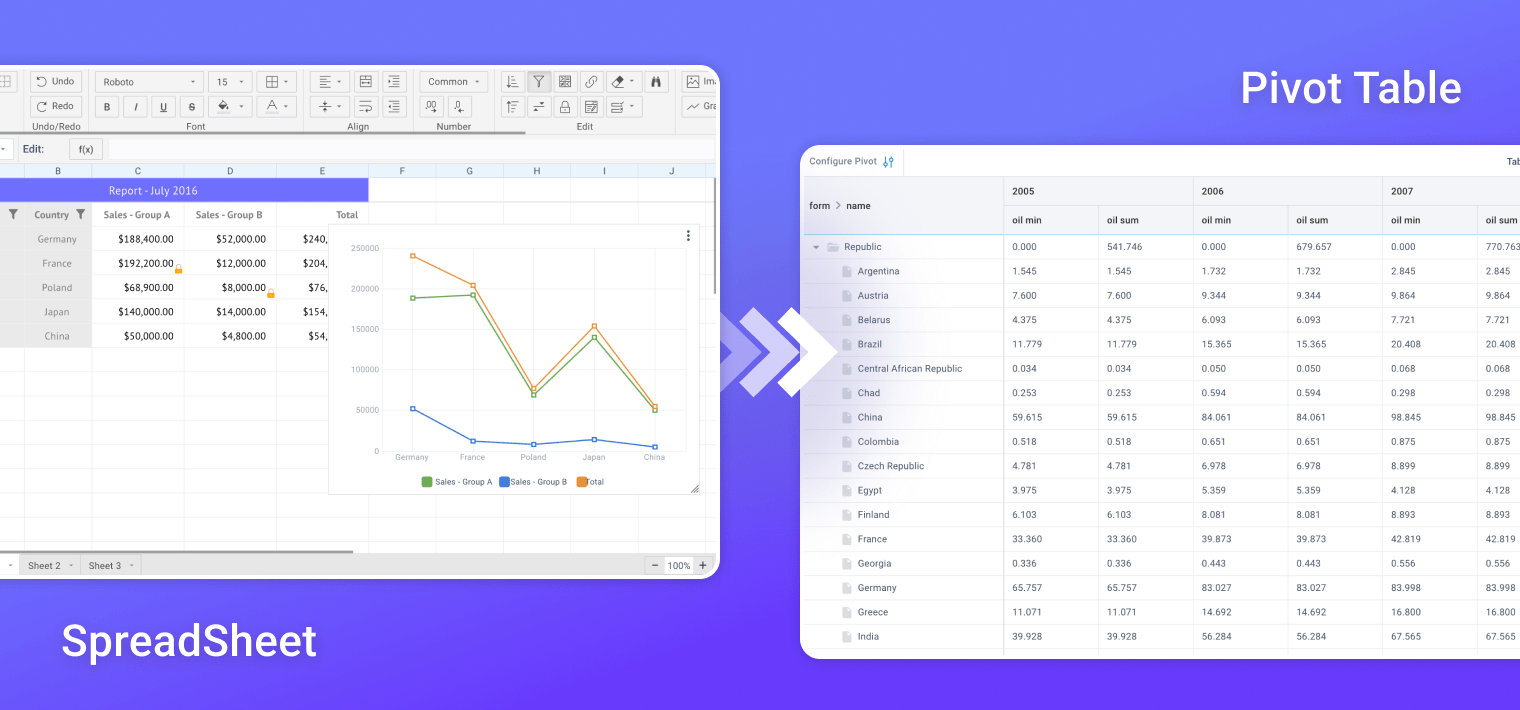
How to Use SpreadSheet with Pivot: Webix Widgets Integration Guide
Webix 11.1: New Rich Text Editor, Improved Big Datasets Handling in File and Doc Manager, Extended SpreadSheet Functionality and more
Webix 11.1 is out! This time we are very excited to present to you a new Webix widget – Rich Text Editor. We have worked really hard to design a convenient tool that will open advanced opportunities for our users and help them extend the functionality of their projects. We also updated and enhanced our complex widgets with new features – File Manager, Document Manager, SpreadSheet, Scheduler, Diagram, ToDo, Gantt and User Manager. Let’s now go further and take a closer look at all the updates.
Webix 2024: A Year in Numbers and Vision for 2025
In this article we are going to look at Webix 2024 year results in facts and figures, as well as share with you our plans for the year that has just begun. We would like to highlight some key points giving you a clearer understanding of how the Webix library is developing. We also intend to keep you informed about practical steps we take for enhancing our products’ functionalities and user experience. So, let’s begin.
The Future of JavaScript: Top 10 JavaScript Trends in 2025
Today we invite you to have a closer look at JavaScript trends in 2025 and make predictions about which of them will determine the near future of web-development. When it comes to forecasting the future we unwittingly start thinking about where to get some magical means for predicting it. And it is a great pity we don’t have any, isn’t it? Not really. We have something far more valuable – our expertise that helps us make precise and reliable technology forecasts.

Webix 11.0 Release: Core Updates, Extended Functionalities in SpreadSheet and File Manager and more
Mastering React Integration: Updated Webix-React Demos
According to the 2024 Development Survey carried out by Stack Overflow, React is on the list of most popular technologies for web development. It holds the top position in the ranking among professional developers with the highest score of 41.6% and it ranks second among all the respondents with the score of 39.5%. Statistics shows that React confidently keeps the lead in the development community and on the market staying ahead of Angular and Vue.js.

Evolution of Webix Complex Widgets: JavaScript Pivot
We continue our series of articles on the evolution of Webix complex widgets and today we are going to plunge into the history of the Webix JavaScript Pivot Table – elaborating on the major changes the widget has undergone and the enhancements it is constantly receiving to ensure the users are provided with a wide range of possibilities facilitating their interaction with data.

Learn about our guest posts guidelines


