We are happy to introduce Webix 4.1 UI library with a Gage widget, Rich Text Editor control, and upgrades for Charts widget. This release of Webix JavaScript library will help you to solve the task of displaying dynamic data. You can create a dashboard for monitoring the performance of several resources and even a complex control panel like in a vehicle or weather station. For more information check our previous updates: minor Webix 3.4 and major Webix 4.0.

Gage widget
How to display speed or pressure in a usual way with a sensor and a pointer? New Gage widget for dashboard gauges is an answer.
Check live demo >>
The new widget shows the measured parameter in a “speedometer” way. The color reflects the value and goes from green (minimum) to red (maximum). The Gage widget allows setting the name and the initial value of the measured parameter, start and end range values, units of measure, as well as the size of the gage. Webix Gage is only available in Webix PRO.
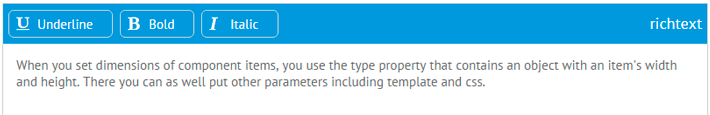
Rich Text Form control
Meet new Rich Text Form control. It’s created in addition to the integration with third-party text editors and Webix Text and Text Area form controls.
Check live demo >>
With the new control end users will be able to edit the entered text and apply formatting in a pair of clicks.
Dynamic Charts
With the new release, Webix Chart gained the ability to animate adding of values in dynamic mode. This mode implies that data won’t be loaded into Chart all at once. Values will appear in Chart with some interval, which allows you to see the whole picture and reveal particular tendencies.
Check live demo >>
With Dynamic charts you can monitor changeable quotes on the market, sales reports, and other valuable data online. The setting is now available for Line, Spline, Area и SplineArea charts.
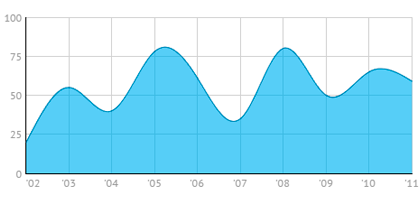
SplineArea Charts
SplineArea Charts — a new type of Charts that combines the features of Spline and Area Charts. Use SplineArea Charts to show gradual changes over time and to highlight the magnitude of these changes.
Check live demo >>
Settings for SplineArea Chart are common with the Area Charts family and include colors, transparency, scales, legend and tooltips that show exact values of the key points.
Updates introduced by the Webix javascript framework will be helpful for those who do IoT business. Infrastructure and manufacture management, environmental monitoring, building and home automation. So don’t waste your time and start coding your new impressive web app with Webix 4.1 JavaScript library for IoT.
Webix 4.1 is backward compatible with Webix 4.0. The release includes a number of updates and small fixes.
Sign in to the client area (only for Webix developer license owners) or Try Free Trial >>