In today’s world, where insights need to be fast, interactive, and user-friendly, developers and analysts turn to data visualization tools that deliver meaningful, real-time data in visually intuitive formats. Looking for an easy way to visualize data effortlessly and with high performance? Check out these 5 best data visualization tools that are available in Webix JavaScript components.They are designed to help you build clear, informative visualizations and analytics dashboards in no time.
Data Visualization: What It Is and Why It Matters
What is data visualisation?
Data visualization translates complex data into intuitive visuals such as graphs, charts, infographics, dashboards or even animation. It’s not about making data just “pretty”. It’s about creating a visual shortcut from raw numbers to actionable understanding.
To clarify: you have a data table in front of you, with a bar chart beside it displaying the same information.
I bet it’ll take you far less time to grasp the chart than to make sense of the table, even though there is not much data here. Data visualization is not just about charts — it’s about clarity.
Why is data visualisation important?
Back in 2014 a team of neuroscientists from MIT found that the human brain can process an image in just 13 milliseconds, which is about six times faster than reading and understanding a medium-length sentence.
Comparison of image and sentence processing time, visualized with Webix Gage charts:

Live demo with the source code: https://snippet.webix.com/9ynptp8q
Best Data Visualization Tools by Webix
Before we jump into the list, let’s quickly outline the key criteria we, as developers, use to evaluate data visualization tools:
- Performance — handles large datasets without lag.
- Ease of Configuration — quick setup with progressive complexity.
- Customization — adapts visuals to branding and UX needs.
- Lightweight — doesn’t bloat the app or slow down load times.
- Integration — works smoothly with modern frameworks and existing codebases.
In Webix we design user-friendly data visualisation tools that just work. No sacrificing performance, customization, or developer experience. Here are Webix’s best components for data visualization that does not require third-party bloat.
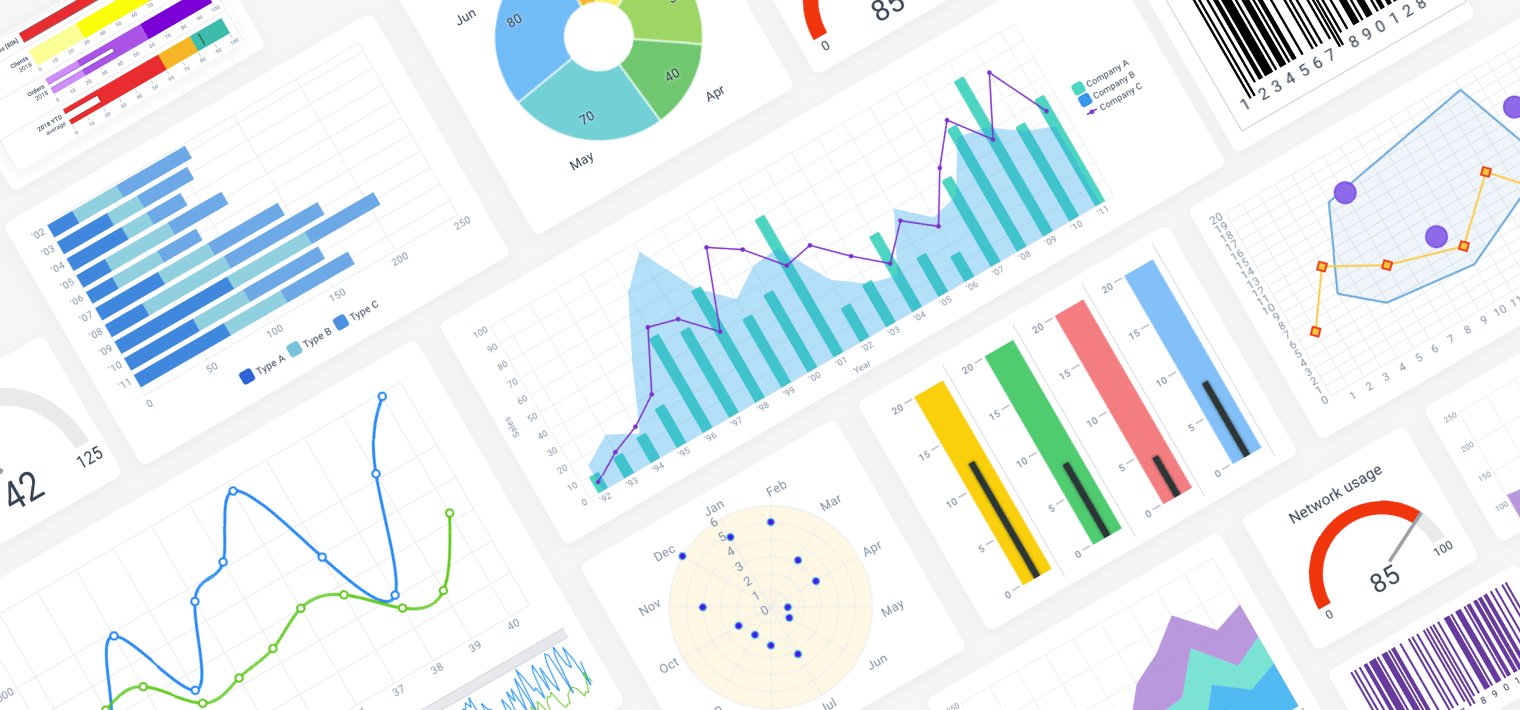
1. Webix Charts – Best Free JS Charting Library for Dashboards
If you are interested in the best free data visualisation tools you found the right article. I’ll start this list with Webix charts, most of them are available in the GPL version that is free. These are the core visualization widgets offering over a dozen chart types, including bar, line, area, pie, donut, radar, and scatter plots. Webix also allows you to show several charts in one and hide them by clicking on the legend.
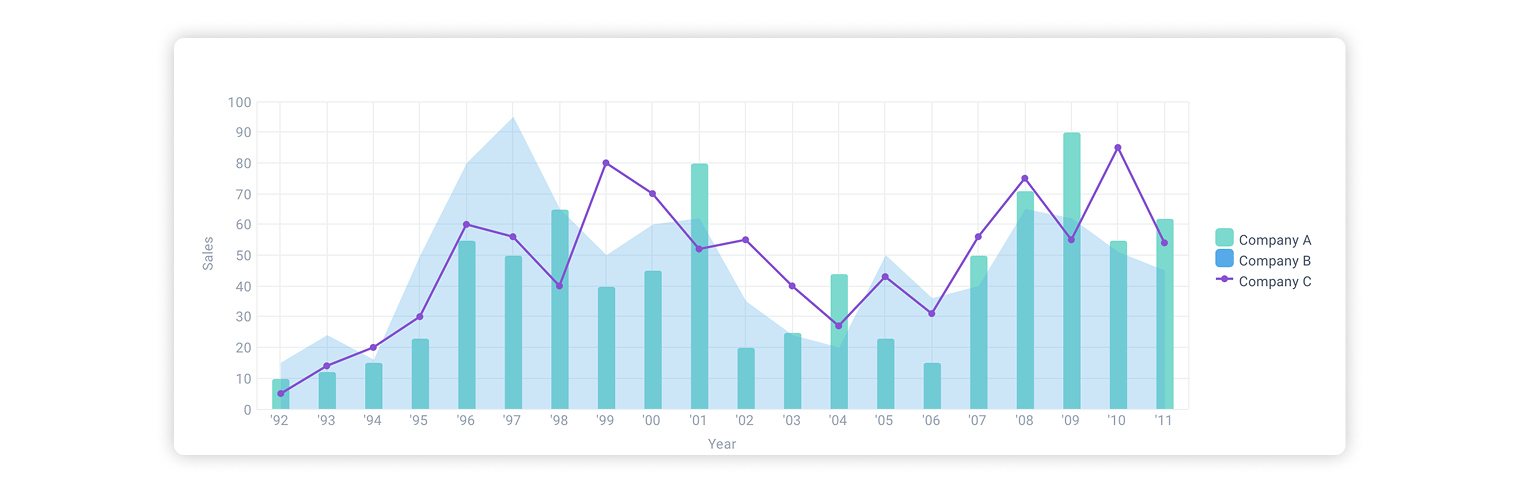
Best for: Real-time dashboards, analytics, and reports
Why it’s great:
- 10+ chart types (bar, line, 2D and 3D pie, scatter, radar) with smooth animations.
- Sorting and filtering by using the corresponding Chart API
- Selecting data ranges with the help of a Rangeсhart
- Drawing by coordinates can be optionally connected into a line or a shape.
Pro tip: If you need super complex visualizations (like force-directed graphs), you might still need integration with charts like D3.js or Highcharts. But trust our web development experience, for 90% of dashboard needs, Webix does the job.
2. Webix DataTable with JS Sparklines – Visualize Data Inside Tables
In cases where separate charts aren’t required but a visual overview is still helpful, data tables with integrated elements become a smart solution for big data visualization. Here is when Webix shines, our JS DataTable can be equipped with sparklines, bar charts, or pie charts.
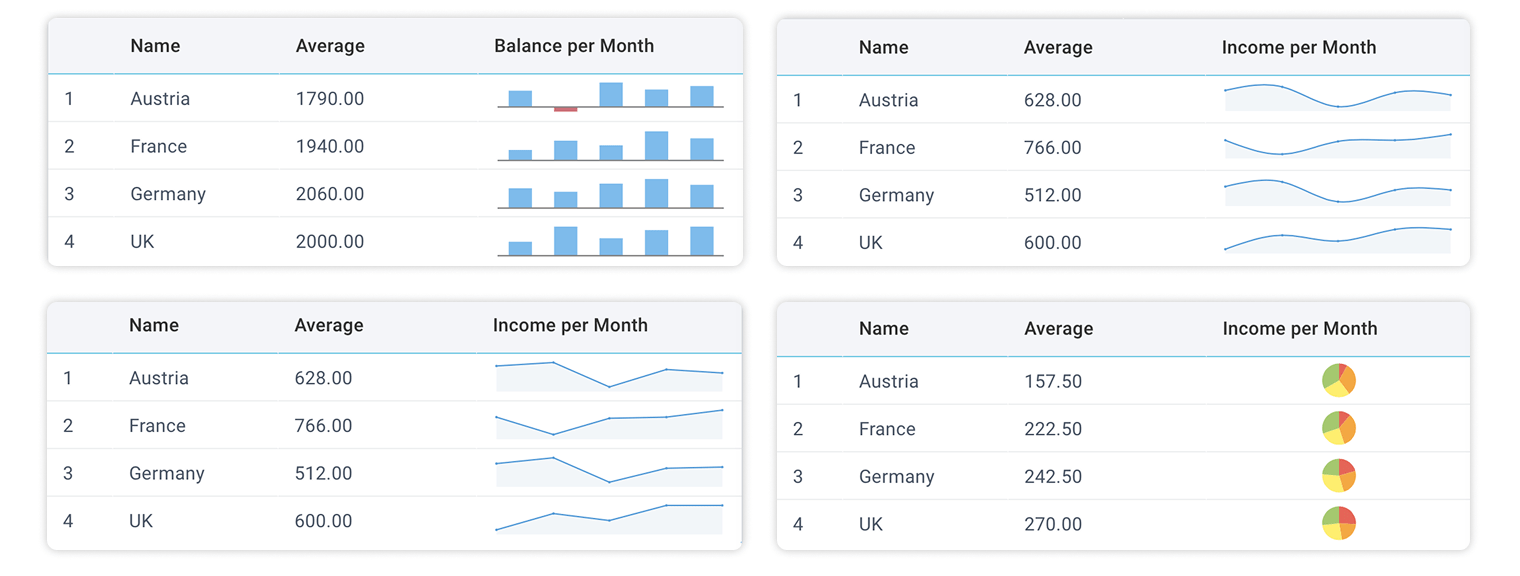
Datatable with sparklines live demo with the source code
Best for: Financial reports, big data, log analysis, and tabular data with visual cues
Why it’s Great:
- Rich data presentation by displaying text, numbers, icons, progress bars, charts and even custom HTML right in the datatable.
- Visual datasets organization with built-in grouping, subrows, and tree tables
- Perfect for big data visualization – handles millions of rows smoothly with virtual scrolling and smart rendering.
Pro tip: For dynamic aggregations the DataTable can be combined with Webix JavaScript Pivot.
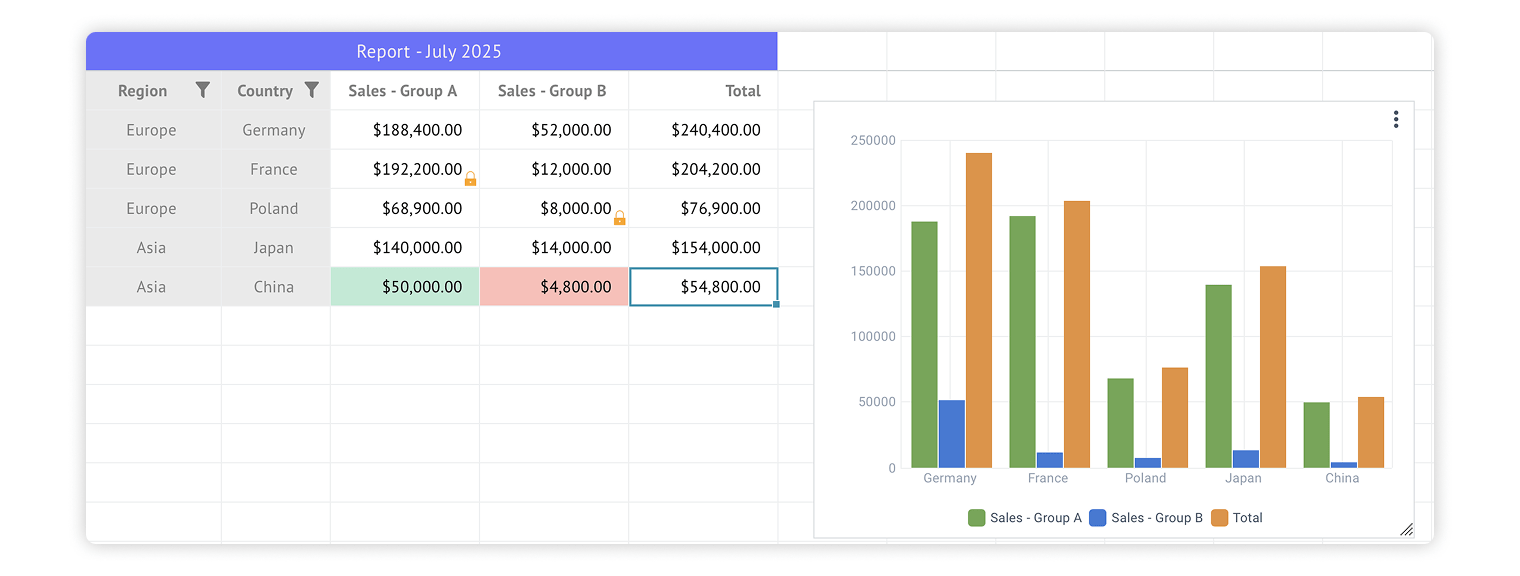
3. Webix Pivot – JavaScript Pivot Table and Chart for Data Analysis
If your application requires processing large datasets, then JavaScript Pivot is exactly what you need. Webix Pivot is a complex widget designed for aggregating and managing big data collections. It offers extensive capabilities for data representation and allows creating tables, reports, and shadcn charts.
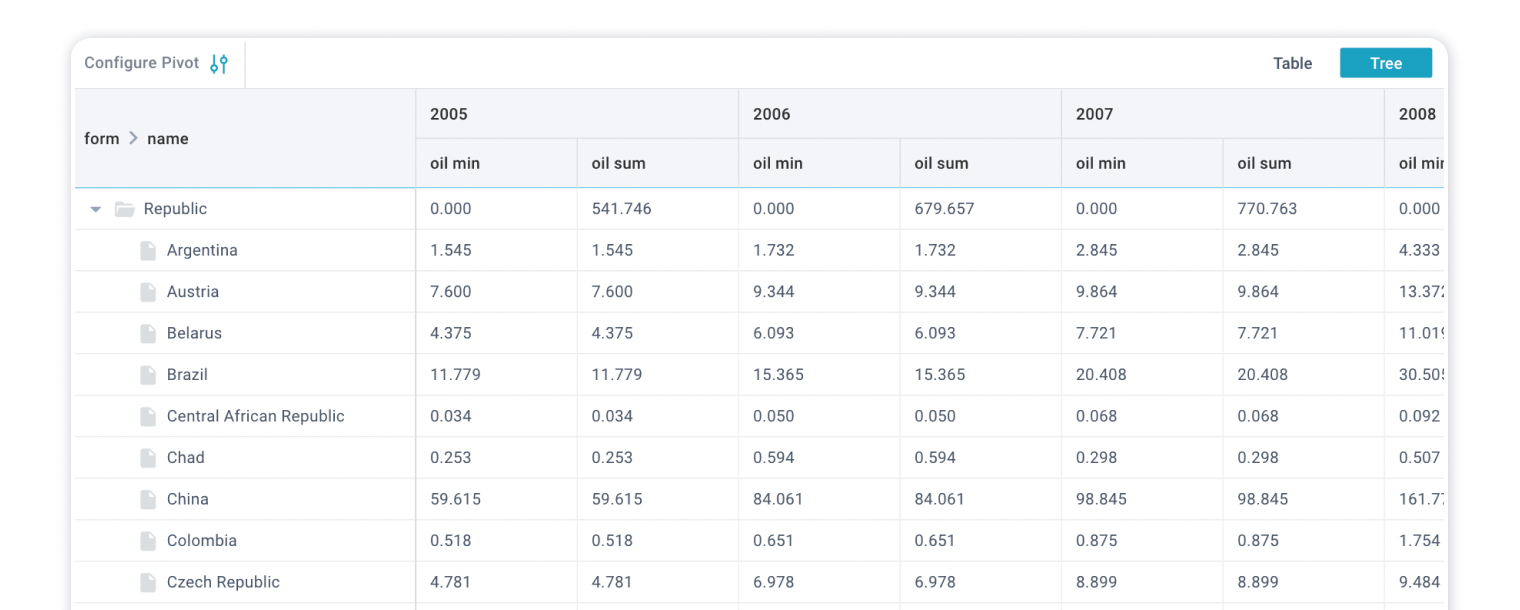
Best for: financial reporting, sales analysis, economic trend forecasting and KPI dashboards creation.
Why it’s great:
- Supports advanced filtering and sorting, drag-and-drop functionality, math functions to manipulate data seamlessly
- Handling summary columns for better data presentation
- Table, Tree and Chart display modes that solves the issue of the source data synchronization
Pro tip: Enhance your workflow by visualizing data directly within your Pivot or Spreadsheet. This integration lets you analyze and present insights without leaving your working table. Read more in our latest article How to Use SpreadSheet with Pivot: Webix Widgets Integration Guide.
4. Webix Diagram – JavaScript Diagramming Tool for Workflow & Logic Visualization
When your app needs to explain workflows, logic, or systems visually, Webix JavaScript Diagram is your go-to tool. This complex widget helps developers and business users build flowcharts, org charts, and process diagrams with ease. You can model business processes, illustrate decision trees, map user journeys, or sketch IT system architecture.
No need for external diagramming tools, you can do it all inside your application.
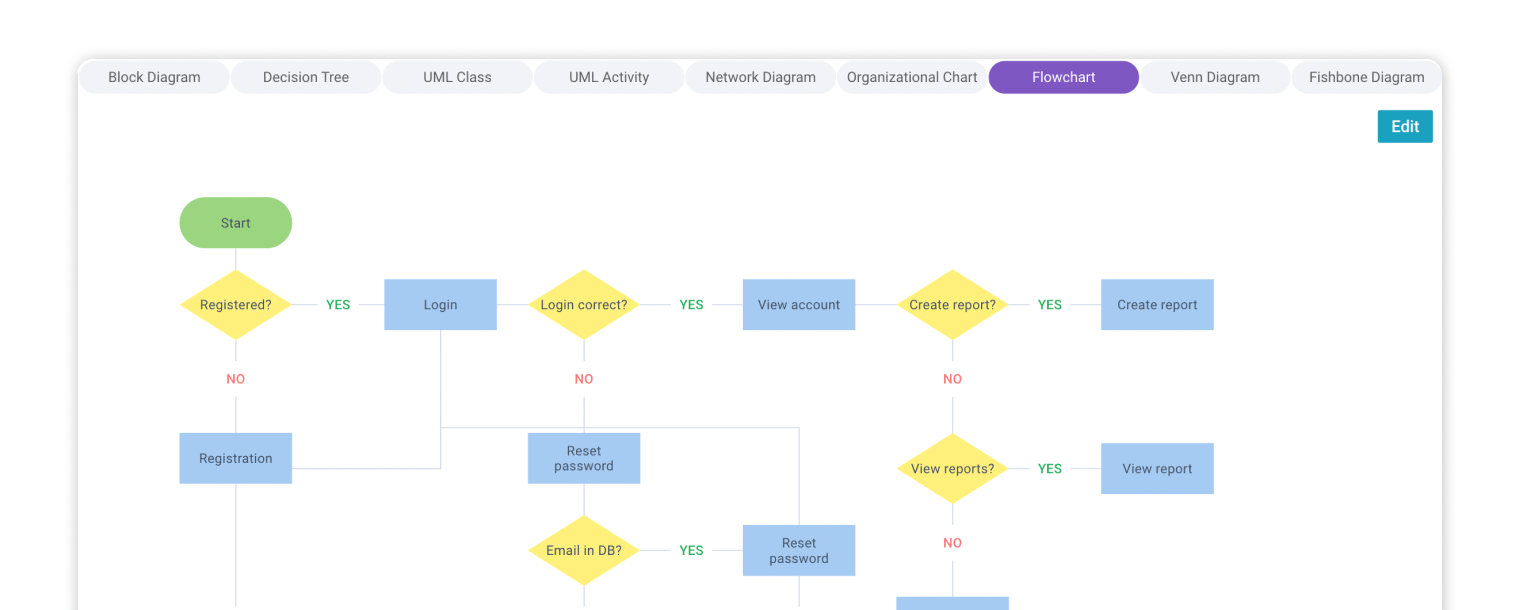
Best for: process mapping, strategy planning, or interactive learning interfaces.
Why it’s great:
- Drag-and-drop interface with real-time canvas updates
- Wide variety of predefined shapes and connectors for fast diagramming
- Custom styling and interaction logic
- Live block, network, Venn and fishbone diagrams, decision tree, UML class, UML activity, organizational chart, flowchart demos.
Pro tip: Enhance project workflow visibility by integrating Webix Diagram with Gantt. Use a mind map to complement your JavaScript Gantt chart and provide a clear visual overview of tasks, dependencies, and team structure.
5. Webix Gantt – Best JavaScript Gantt Chart for Project Planning
When a simple task list isn’t enough and a visual timeline is crucial, JavaScript Gantt charts become the ultimate tool for project management. This is where Webix shines: our JavaScript Gantt lets you plan, schedule, and track tasks with precision.
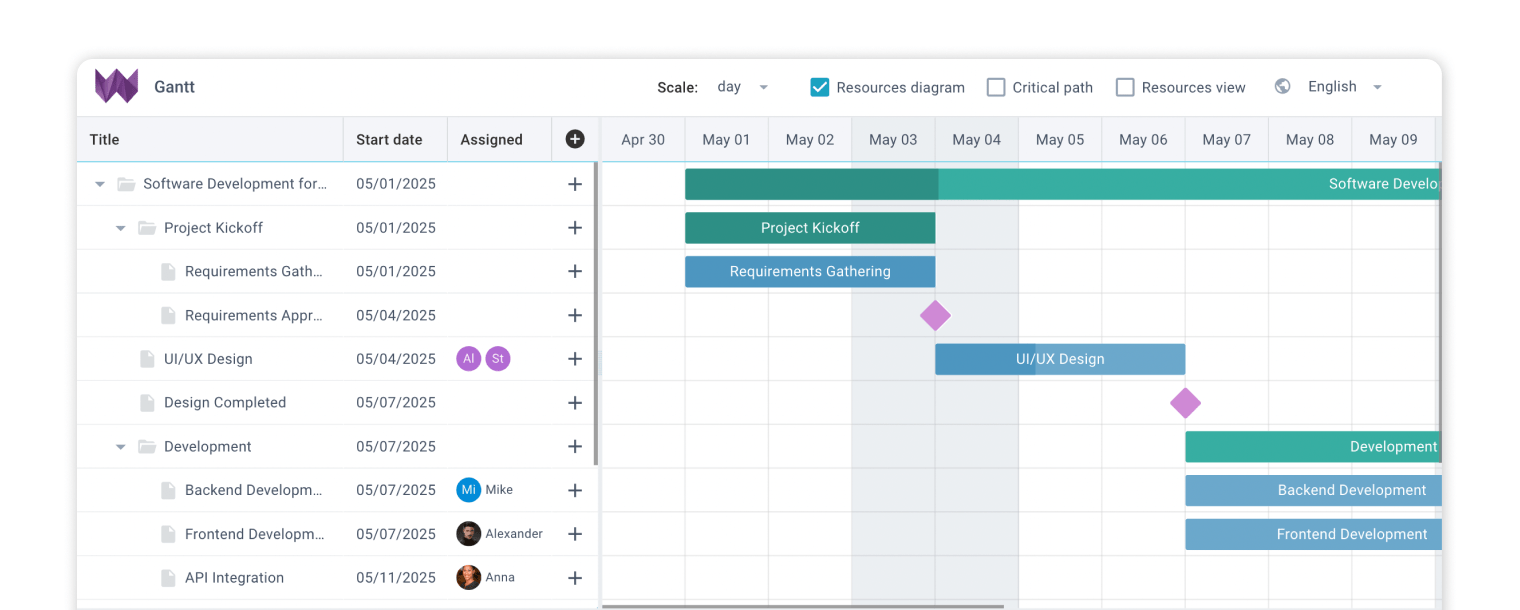
Best for: Project management apps, resource planning, and workflow visualization
Why it’s great:
- Clear project visualization with tasks, dependencies, milestones, and baselines.
- Flexible editing: drag-and-drop tasks, resize timelines, and adjust dependencies right on the chart.
- Scales effortlessly from small projects to enterprise-level workflows.
Pro tip: Combine the Gantt with Webix JavaScript Scheduler for an all-in-one planning and calendar solution.
Conclusion
Each Webix visualization tool is optimized for a different kind of insight: from micro-level metric tracking to high-level executive reporting. Whether you’re a developer building internal dashboards or a business analyst compiling quarterly reports, Webix provides a powerful and customizable toolkit to match your data visualization needs.
| Widget | Best For | Pricing |
| Webix Charts | Real-time dashboards, analytics, and reports | Free (GPL)/ Pro |
| Webix DataTable | Financial reports, big data visualization, log analysis, tabular data with visual cues | Free (GPL)/ Pro |
| Webix Pivot | Financial reporting, sales analysis, KPI dashboards, economic forecasting | Pro only |
| Webix Diagram | Process mapping, strategy planning, workflow visualization, interactive learning interfaces | Pro only |
| Webix Gantt | Project management apps, resource planning, workflow visualization | Pro only |
If you’re ready to streamline development and empower data-driven decisions, start your free trial or explore Webix licenses.