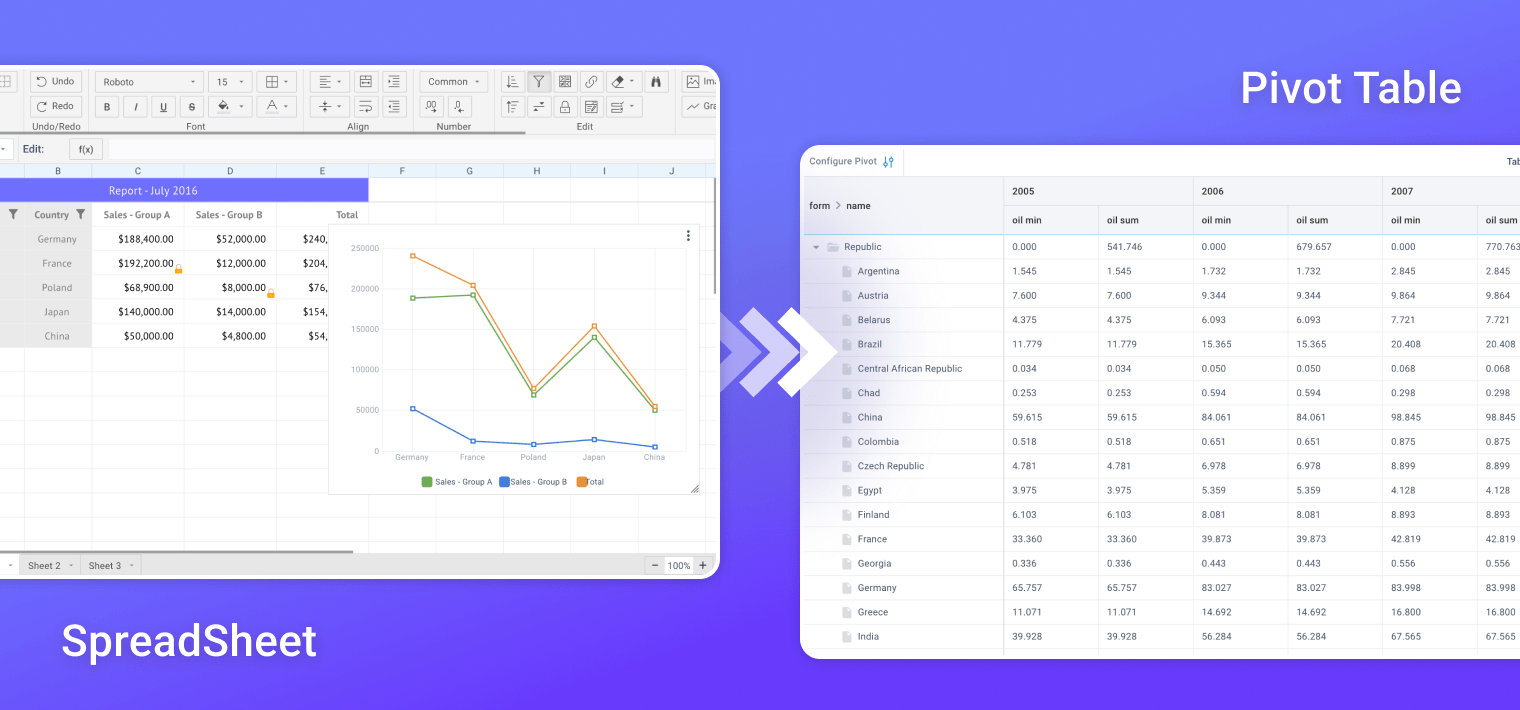
Software can make your routine simpler and with better results. For instance, making clear and good-looking reports would turn into a real battle without a helpful tool. One of these tools is Excel, a well-known mega-beast of valiant deeds and immortal glory. Yet, if business-warriors have to make some custom report, it’s developer-warriors who get their share of the job. This might be a problem. Every time you have to involve extra people in routine procedures, it’s costly and time-consuming (to say nothing of the fact that developer-warriors have a lot of other battles to fight).

It would be good to design a report engine — another mega-beast that is as powerful and helpful. The complex widget SpreadSheet, one of the components of the Webix UI library, is a relevant core element for a decent mega-beast to win the deathmatch and save your end-users from extra expenses. Join me, developer-warriors, and I’ll show you how to enhance SpreadSheet and make it serve business-warriors well in their battles. Together we’ll create a spreadsheet-based report engine that will allow your end-users to make a custom report themselves by choosing templates from a list and editing them to their liking.
Constructing a Skeleton
Let’s begin creating the report engine with the skeleton of our beast. It’ll have two flanks, the overall design is this:
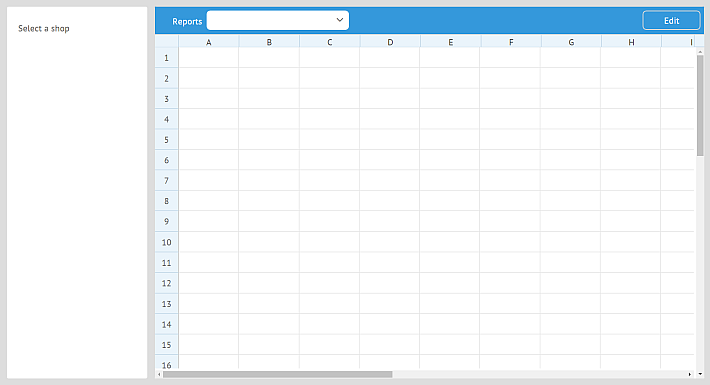
Let’s begin with the left flank, which will contain a list of shop names. Later I’ll load the list with data that contains statistics for these shops. For now, there will be just an empty list:
view:"list", scroll:false, borderless:true,
id:"departments",
width:200,
select:true
};
var listPure = {
view: "form", id:"right",
rows:[
{ view: "label", label: "Select a shop" },
departments
]
};
Let’s move on to the bigger right flank with a toolbar and a spreadsheet area. Here’s the toolbar with a richselect that will have a list of reports and a button for switching between edit and readonly modes:
view:"toolbar",
cols:[
{ view:"richselect", labelAlign:"right", label:"Reports",
id:"reports", options: [], width: 320 },
{},
{ view:"button", value:"Edit", width: 100, id:"edit" }
]
};
The spreadsheet area at this point will contain an empty datatable, which is to be expected. Here’s the whole right flank:
rows:[
toolbar,
{ id:"ssheet", view:"spreadsheet", readonly:true }
]
};
After putting all the bones together, we have the skeleton:
type:"space", cols:[
listPure,
reportPanel
]
});
The skeleton of our beast is ready, so let’s move on to the next step.
Augmenting the Skeleton with some Muscle and Brain
Let’s give the beast the first bit of knowledge — data for displaying reports. I have the data in a JSON file (data/reports.json), the contents of which is an array of three objects. Each object contains data and styles for a single spreadsheet, e.g.:
"styles":[
["wss3",";#efefef;;;;;;;;;;;;;;"],...
],
"data": [
[1, 1, "Sales 2016", "wss7"],
[2, 1, "Store", "wss4"], ... ,
[3, 1, "={{value}}", "wss3"],[3, 2, "={{janinc}}"], ...
],
"spans": [
[1,1,14,1]
],
"sizes":[
[0,1,225]
]
}},
Mind that instead of real values in data I specified placeholder properties, for instance, “={{value}}”. During the last step, I’ll load real data into them.
Now let’s load the data into a DataCollection:
Our beast will show three different reports, but in real tasks a number of reports can be much bigger. That’s why, instead of creating separate spreadsheets for each type, let’s define a function that will recreate the same spreadsheet with different parameters every time another type of report is chosen:
webix.ui({
view:"spreadsheet", readonly:readonly, id:"ssheet",
}, $$("ssheet"));
if (id)
$$("ssheet").parse(datasource.getItem(id).sheet);
};
The first parameter is the ID of a report from the DataCollection, the second one will be needed later when you’ll teach the beast to edit reports (for now I’ll always set this parameter to true). The second parameter of the webix.ui constructor is the view to be replaced by the first object parameter. Therefore all you need to specify during its first initialization is the id of the spreadsheet view:
//...
{ id:"ssheet" }
]
};
Now it’s time to add some meaning to the richselect: an event handler that will recreate the spreadsheet with new data if another report in the richselect is chosen.
View:"toolbar", cols:[
{ view:"richselect", labelAlign:"right", label:"Reports", id:"reports", options: [], width: 320,
on:{
onChange:function(){
showSpreadsheet(this.getValue(), true);
}
}},
//...
]
};
Finally, let’s initialize the spreadsheet and load the data. The promise object datasource.waitData makes sure that our beast will act only when it gets the data.
showSpreadsheet(0, true);
$$("reports").getList().parse(datasource);
$$("reports").setValue(1);
});
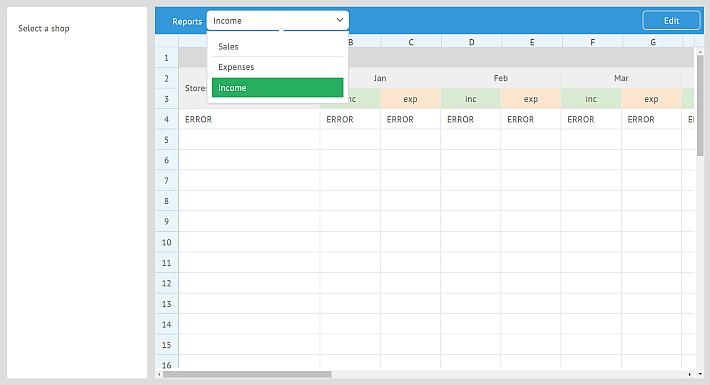
At this point, the app doesn’t show any real data, only three templates for reports:
Teaching the Beast to Edit
Good. Now the app allows choosing a report type from a list, but you cannot edit reports, not yet. It’s the time to change that. Let’s begin by modifying the showSpreadsheet() function:
if (readonly != $$("ssheet").config.readonly){
webix.ui({
view:"spreadsheet", readonly:readonly, id:"ssheet"
}, $$("ssheet"));
}
if (readonly){
$$("ssheet").hideGridlines(true);
$$("ssheet").hideHeaders(true);
}
//parse data
};
Now the function really uses the readonly parameter: first, it reinitializes the spreadsheet with a different mode according to the value of readonly, and second, hides unnecessary for the readonly mode grid lines and headers. Be careful to put the code of the latter before parsing the data, because otherwise hiding headers will interfere with the correct rendering of the data.
Let’s change the toolbar. Remember that Edit button? This is the moment to program it for some action. Let’s add a property to it:
As the spreadsheet is initialized as readonly: true, so will be the sheetState property. When you click Edit, the state will change to false. Let’s add an event handler to the button:
var readonly = this.config.sheetState = !this.config.sheetState;
var reportId = $$("reports").getValue();
//recreate report view
showSpreadsheet(reportId, readonly);
}
Apart from displaying spreadsheets in the edit mode, the function loads data from a corresponding placeholder object for editing. For saving edited reports, there’s no need to define another button. Let’s just add a few lines of code to the above handler:
var readonly = this.config.sheetState = !this.config.sheetState;
var reportId = $$("reports").getValue();
if (readonly){
//save data
datasource.updateItem(reportId, { sheet:$$("ssheet").serialize() });
}
showSpreadsheet(reportId, readonly);
//change the label on the button
this.config.label = readonly ? "Edit" : "Save";
this.refresh();
}
Depending on the mode of the spreadsheet, the same button will act as either the Edit or Save button.
The readonly mode for the richselect should be defined by the state of the Edit button as well. This is necessary if a user switches between reports without exiting the edit mode:
//...
{ view:"richselect", //...config
on:{
onChange:function(){
showSpreadsheet(this.getValue(), $$("edit").config.sheetState );
}
}},
{},
//the Edit btn config
]
};
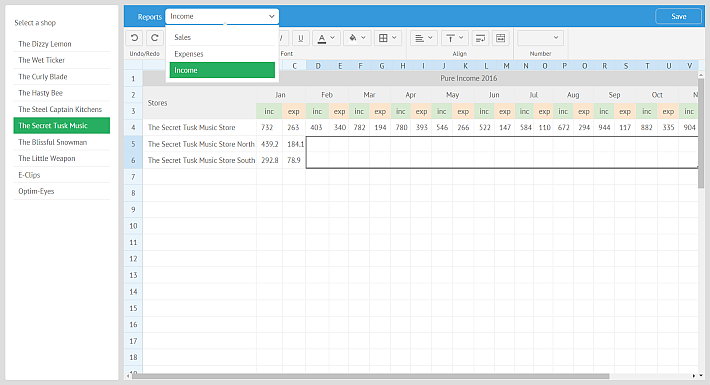
At this point you can switch between modes, edit reports, and save changes.
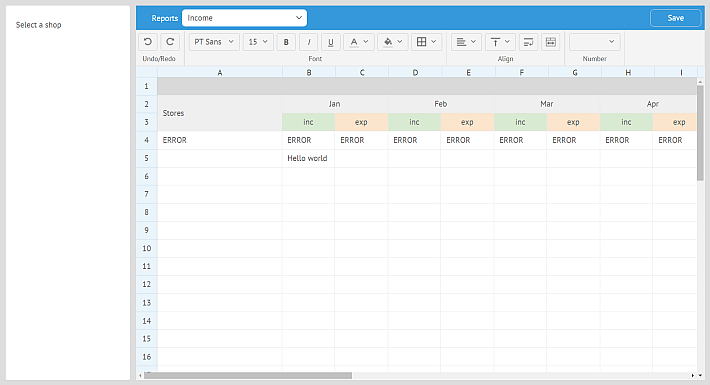
Giving the Beast More Knowledge
ERROR looks so hopelessly wrong and disappointing. It’s time to provide the mega-beast with the real placeholders for spreadsheet data. The placeholders are in the shops.json file in the same data folder. Let’s load them into the list on the left panel and enable selection of right placeholders for every shop on the list:
view:"list",
//...
on:{
onAfterSelect:function(id){
$$("ssheet").setPlaceholder(this.getItem(id));
}
},
url:"data/shops.json"
};
To keep the same placeholders when another report type is chosen, let’s add a few lines of code to the showSpreadsheet() function:
//...
var placeholders = $$("departments").getSelectedId();
if (placeholders)
$$("ssheet").setPlaceholder($$("departments").getItem(placeholders));
};
Finally, let’s ensure that the data will be loaded correctly when ready, and select the first placeholder on initialization:
//...
$$("departments").select(1);
});
As you see, now we iterate through two promises from both the reports and the placeholders.
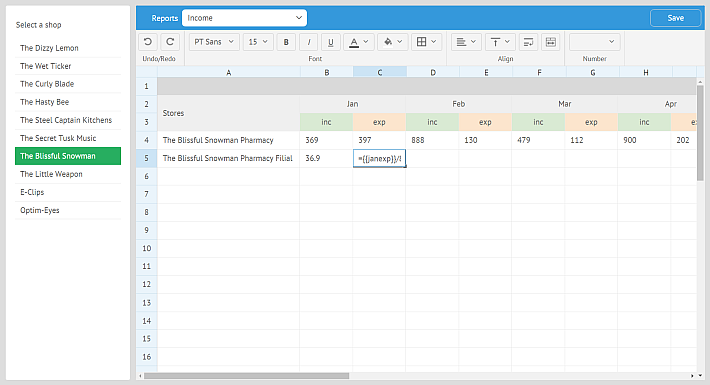
Now the app is ready to load, render, edit, and save the data into reports. Here the data is saved into a collection, but you can save it to a server, of course.
Conclusion
Great, the SpreadSheet mega-beast is ready for battles. It can load the data, edit, present it in different ways and hopefully make this world a better place. You can define your own reports and enhance the app further to let users create their own report templates and add them to the list. If you have ideas that you want to share with us, drop us a line below.
You can have a look at the source code and download it from the Github repository. I wish you and your end-users many a glorious battle, and may the SpreadSheet be with you.
For further info, you can check out the following related links: