Bonjour everyone!
Another week, another cool showcase from our customers. Today we are glad to present Bruno Denis from a french company BNDC. The project is called MyMetriks, it’s a business intelligence dashboard platform built by using Webix UI and modern web technologies.
About MyMetriks Platform
MyMetriks is a simple and intuitive business intelligence dashboarding platform designed for fast data analysis and visualization. Build 100% HTML5 and nodejs, it gives to all users possibilities to create/customise the dashboards they really need. It is cheap, based on all latest technologies and really fast thanks to in-memory data cube management.
Dashboard Design
Technology Stack Behind MyMetriks
All dashboard operations are performed via intuitive click actions or drag-and-drop, including full dashboard creation and customization.
All the solutions are based on Webix framework.
We have developped our own Nodejs ajax JSON adapter based on Webix proxy. The platform is fairly simple: nodejs, mysql, Webix and a specific columnar database for Business Intelligence performances.
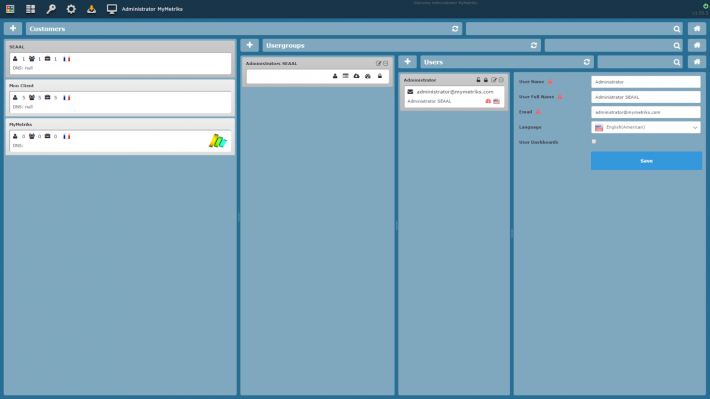
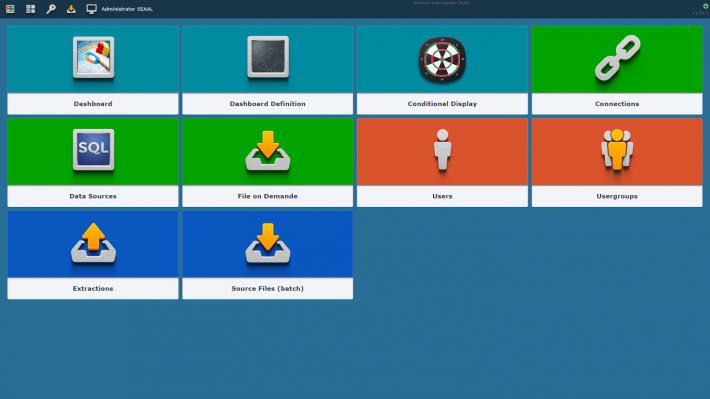
Customer Management
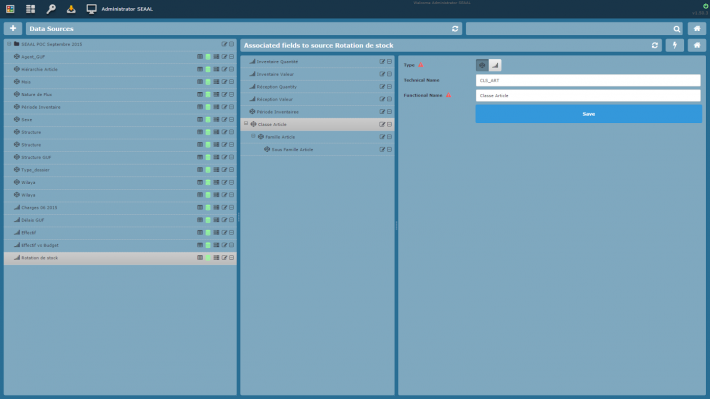
Data Sources
Why BNDC Chose Webix: Dashboards, Data Visualization, and Exports
While chart components are powered by Highcharts, all data grids, scorecards, and interactive tables are built with Webix UI.
Graphic components can be be changed on the fly (unlike our main competitors) as well as Axis and Indicators, Hierachical levels are also dynamic.
Grid can export data to Excel (we developed our own exporter before Webix that extract colors and css with xlsxjs).
With Webix you can also export data to Excel, and after release of Webix 3.0 they also plan to extract colors and css with xlsxjs.
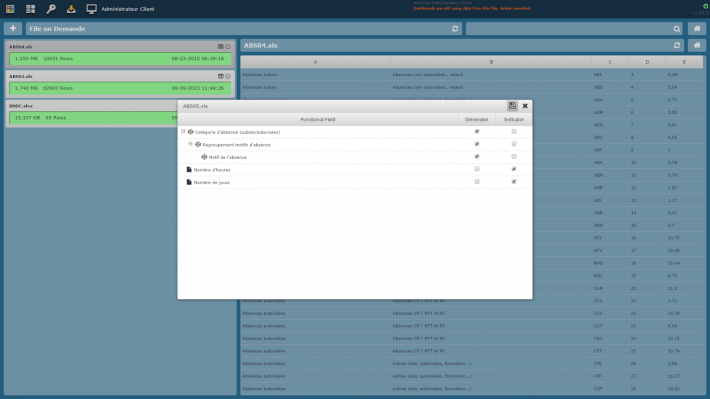
User Files
User Menu
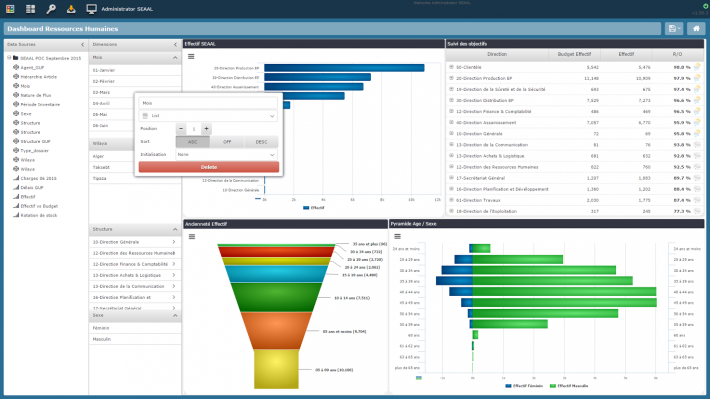
The platform contains all common graphical (bar/line/area charts, pie/donut charts, pyramid, map, funnel, treemap, bubble charts, …) and list objects (grid, scorecard and pivot soon). All objects are dynamic (filtering, drill down) and can be changed on the fly as well as indicators and axis. Data can be exported excel or PDF/JPEG/PNG.
Dashboard Example
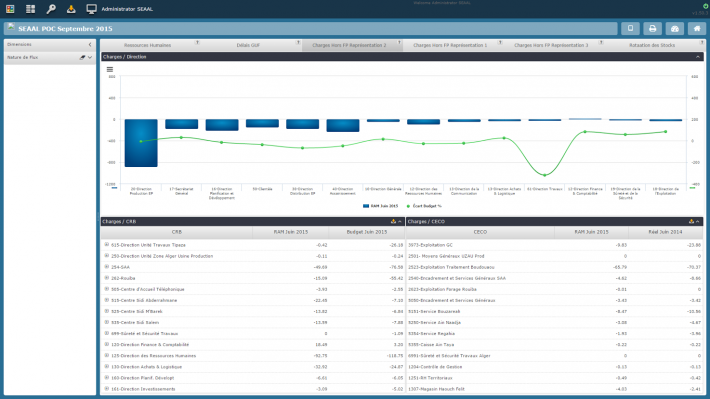
Objects can be designed and customised by drag and drop. Users can integrate their own Excel spreadsheets and create dashboards out of them.
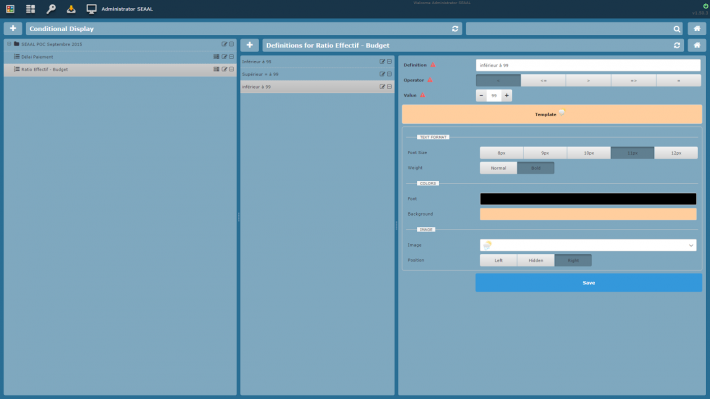
Conditional Display
MyMetriks has been already awarded “young innovative entreprise” in France and significant references are being deployed. We will shortly order license for Pivot and support as we will definitely need it.
***
We want to thank BNDC company team for the material and their feedback.
If you are building a real-world application with Webix, whether it’s a BI dashboard, SaaS product, or internal analytics tool, we’d be happy to feature your project on our blog.