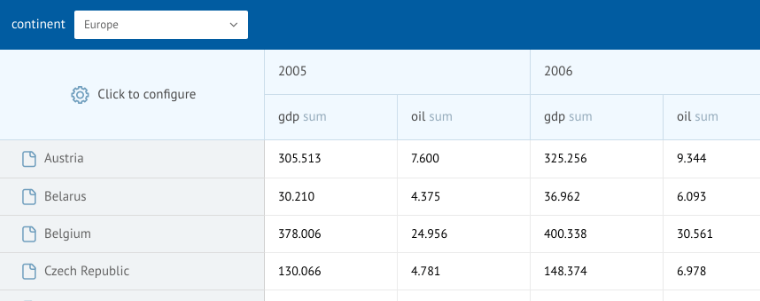
Webix UI library offers a complex widget for creating Pivot tables and well-organized visual reports over big volumes of information and any data source type. Pivot component enables you to efficiently sort, filter, and compare data in a table.

Webix Pivot is a nice-looking, fast, and cross-functional UI component that has been in high demand among Webix users for many years. Though our developers make every effort to ensure sustainable work of all the components, there are still some issues that our customer service has to deal with. One of the hottest issues is the problem of data volume in Pivot widget.
The issue of data volume
Pivot table widget performs hard tasks of calculating and aggregating complex data. Some developers may experience problems when trying to process large volumes of data and create big reports in Pivot widget. In this case, their application may start working slowly and less efficiently.
Such behavior is quite predictable. Let’s not forget that all calculations, data aggregation, and rendering are performed on the front-end side of your solution. And there is a number of hardware limitations that won’t allow you to generate infinitely large Pivot reports.
There are some objective reasons why many developers choose to load excessive quantities of data in Pivot and create complicated reports.
The reasons include the following cases:
1) When a new user is just learning how to use Pivot widget. Sometimes newbies can play with data to understand how system works and create large and meaningless reports.
2) When users need to make sure that the necessary data are included in the table. For example, when they want to study the extreme values in a data sample or make an overall evaluation of a data array.
3) In case of BigData management.
Technical limitations while working with Pivot
Judging by scrolling, Pivot widget generates a grid with a fairly large number of rows. Let’s assume that it has about 10,000 rows and 30,000 columns. In this case, to build a Pivot table it is necessary to calculate and store 300,000,000 values (which can consumpt approximately 1.5 GB of memory).
There is often a strict hardware limit on the size of the web page that a browser renders. For example, IE limits it to 10 mln pixels which are equal to 500, 000 rows. Nevertheless, Pivot can generate such big and even larger datasets but there may appear some server problems.
There is a logical question about the point and practical benefits of creating huge and complicated reports. Apparently, it’s better to limit the maximum size of reports, allowing users to select any grouping options but limiting the number of columns that can be created. This will ensure generating reasonable reports and no errors will occur if a user accidentally selects a column structure leading to a gigantic report.
How to solve the issue
1. You can use pagination. It might seem contrary to the idea of displaying all the data on one page. But you should analyze whether it is necessary and rational to show excessive quantities of data on a single page.
2. One of the possible solutions is to add a new functionality – lazy rendering. It will enable you to change the rendering mechanism of the grid. The final data will be calculated directly at the time of rendering and only for the visible area. If you have lots of columns, the grid will render only those that are visible. This mode will allow you not to store all the values (only the group structure will be stored).
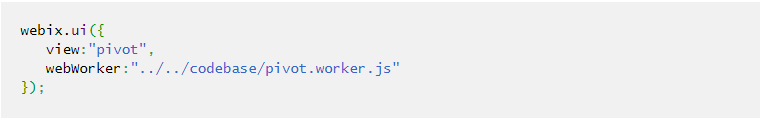
3. Together with Pivot, you can use HTML5 Web Worker. This tool takes all the data processing into a separate thread. It ensures that all data is processed in the background and the interface doesn’t get blocked.
Note that the speed of calculations will remain the same, but what is important, the UI will stay fully available and high-performance.
There is a web worker script that takes all the data aggregation to the background and can be switched on when needed.
You can find the script code in the “codebase” folder. If you want to use the web worker, you have to set a path to it in the configuration object:
4. By default, Pivot groups and recalculates all data on the client side. If you want to improve user experience and accelerate data processing, you can migrate calculations to the server. In this case, Pivot will be able to send a request with the desired configuration to the server and get the data grouped according to the request.
Bottom line
Pivot table widget is a powerful JavaScript component that can handle large amounts of data items. If the data is excessively big, the user interface might become unresponsive. In most cases, the amount of data can be limited without affecting the web app efficiency. But if you still need to process huge volumes of data in Pivot, you can overcome possible UX issues with 4 solutions mentioned above.