Introduction
Day by day the world is getting faster. News is being spread around the world within minutes while the search for information is reduced just to surfing the Internet. Nowadays developers don’t spend months or years on the implementation of new ideas, this process can take just a couple of days or maybe weeks. At the same time, the process of developing web apps and sites is going up to a new speed level.The tools of building websites are getting smarter and even easier to use.
Code generators, autocomplete, code analyzers, libraries and frameworks have settled down in the developers’ life. They let reduce the time of site development to the minimum. The Internet itself is developing together with these tools.
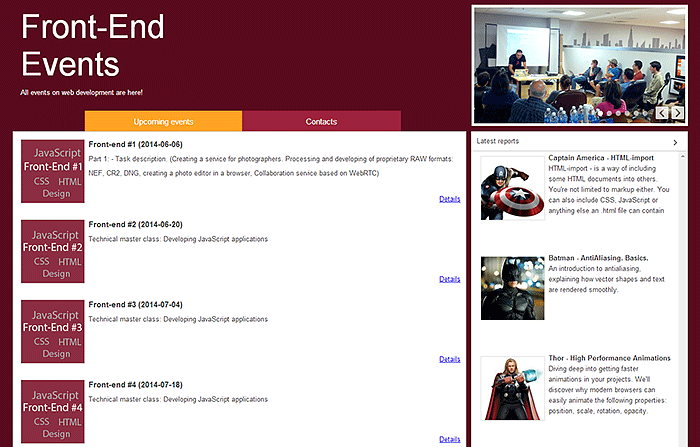
Not long ago sites have presented static data while their functionality has been rather minimal. Today sites are fully-functional applications which allow performing the actions that earlier have been available on desktop only. One of the tools for fast building of a web app’s interface for both mobile and desktop devices is Webix, a JavaScript UI widgets library.
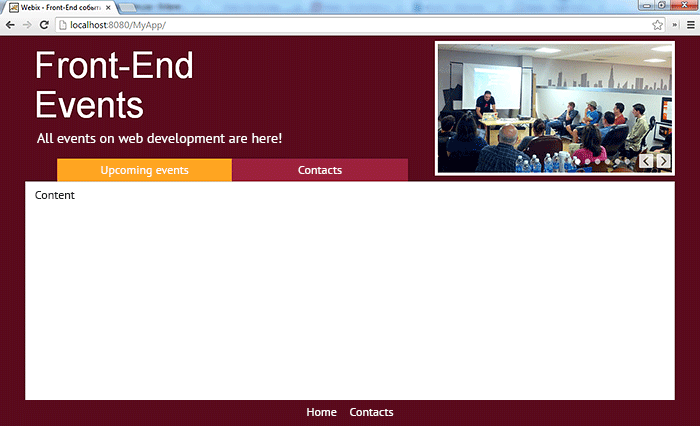
Let’s consider an example of creating a site aimed for announcing future conferences on front-end development with the help of Webix and a Java-framework Struts 2. It will look as follows: