If you want to add JavaScript charts with main Pivot Table functions to your web app, you can use Webix Pivot Chart. This powerful component shows data series, categories and chart axes the same way a widget JavaScript Charts does and provides you with interactive filtering controls for quick dataset analyzing.
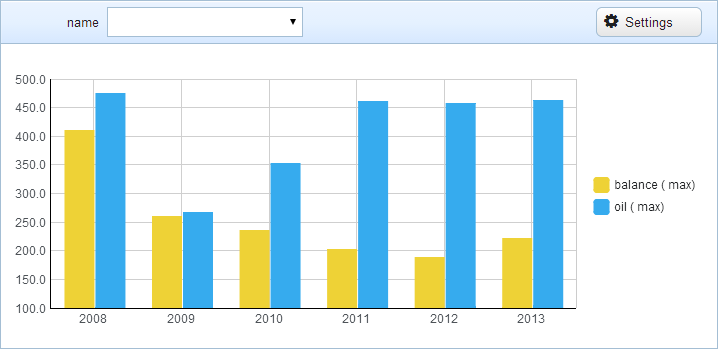
Pivot Chart delivers various types of charts: line and spline chart, area chart, bar chart, pie chart, 3d pie chart, donut chart, scatter chart, and radar chart.
By using CSS-code, all the elements of the tool (titles, legend, chart location) can be easily customized in accordance with your enterprise style.
Pivot Chart is able to load data in XML, JSON, JSArray and CSV formats from local drive or from external sources.
The way of data representation in the chart-report can be changed by dragging and dropping its fields. No more excessive coding!
Moreover, Webix Pivot Chart:
- Loads huge amounts of data at a high speed
- It is fully client-side
- It runs on both desktop and mobile devices
If you want to have the same nice pivot chart, download it now.
This tutorial will assist you in learning Pivot Chart.