Updated September 2025
The implementation of robust solutions for handling large quantities of data has become a new norm for web application development. The exponential growth of data can be quite a challenge as the tools we utilize should ensure data availability, high processing speed and provide against delays or inconsistencies. As large datasets are often used in advanced analytics, business intelligence and statistics – minor downtime can cause major issues. Today we are going to carry out an in-depth analysis of Webix JS DataTable – a cutting-edge solution for managing extensive data efficiently.
UPD: As of August 2025, the full capabilities of Webix DataTable are now available in a standalone package: powerful JavaScript Grid. Designed for high-performance, enterprise-ready applications, Webix Grid delivers the same speed, flexibility, and reliability as DataTable.
All the performance tests and benchmarks highlighted below apply equally to Webix Grid.
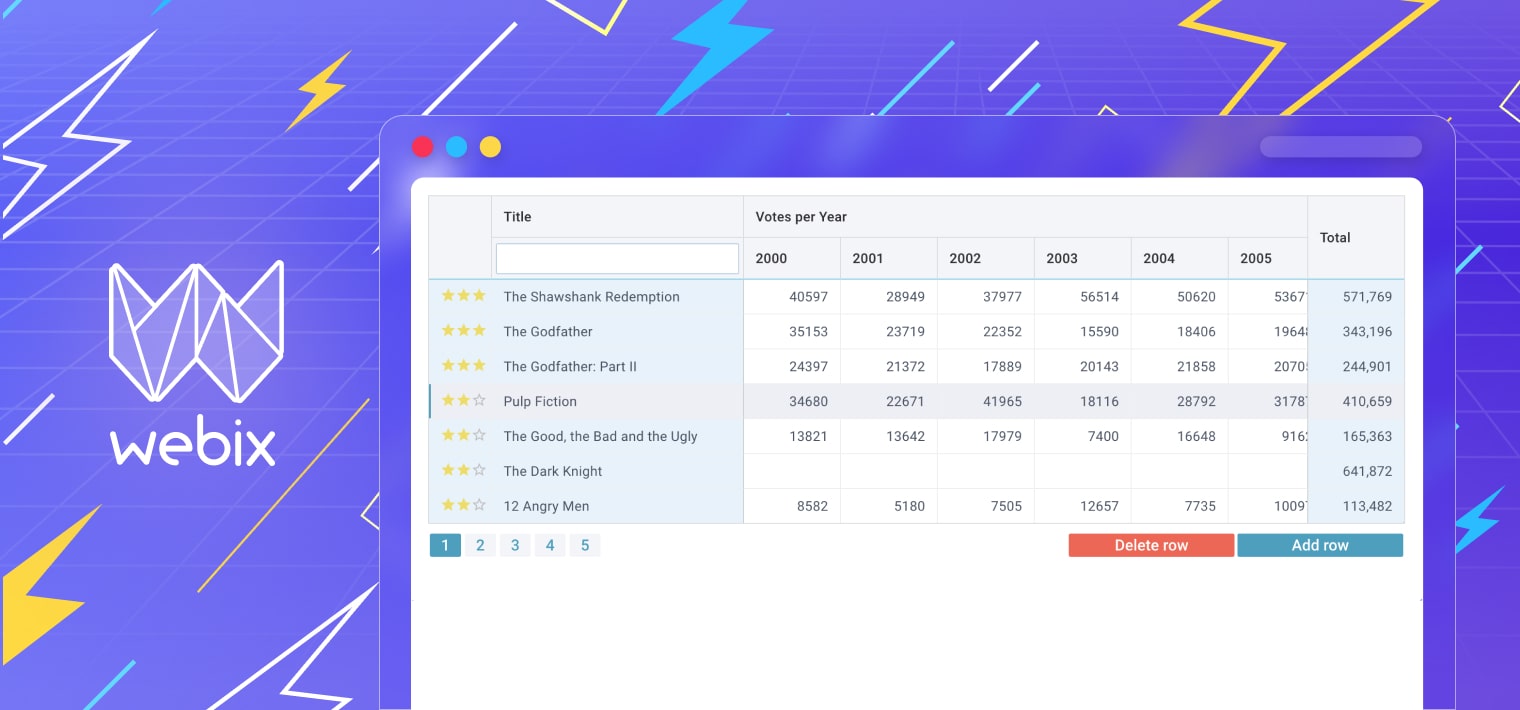
Webix JavaScript DataTable (or DataGrid) is a data management widget with an impressive list of features and settings for sorting, editing, filtering, validating data – and that’s not the half of it. The widget supplies the users with a whole bunch of sophisticated tools facilitating efficient data manipulation.
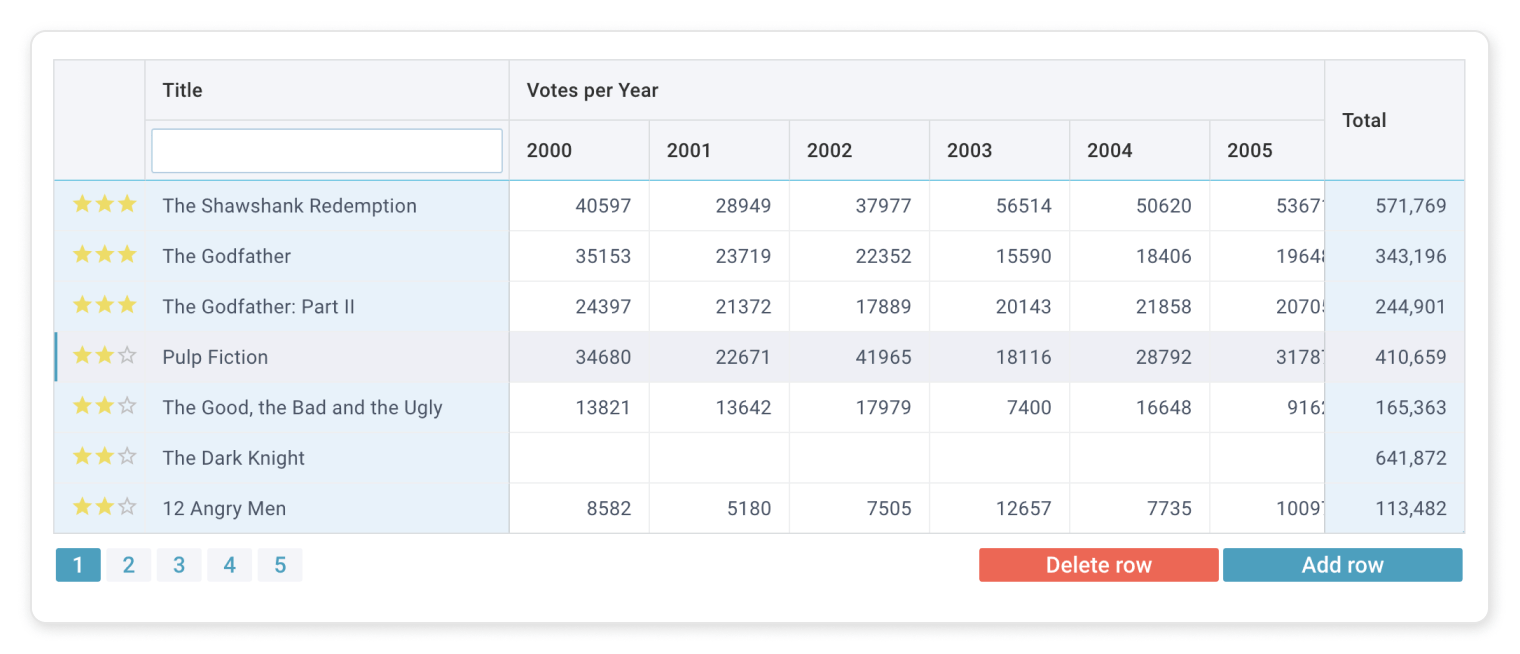
There is one more distinctive feature Webix JS DataTable is notable for – it significantly outperforms similar solutions in rendering speed. Such a high level of performance is the result of the widget deep optimization. Let’s continue talking about performance and study all the facets of the matter.
Factors Affecting JavaScript DataGrid Performance
The major factors that determine the resulting performance when working with large datasets include:
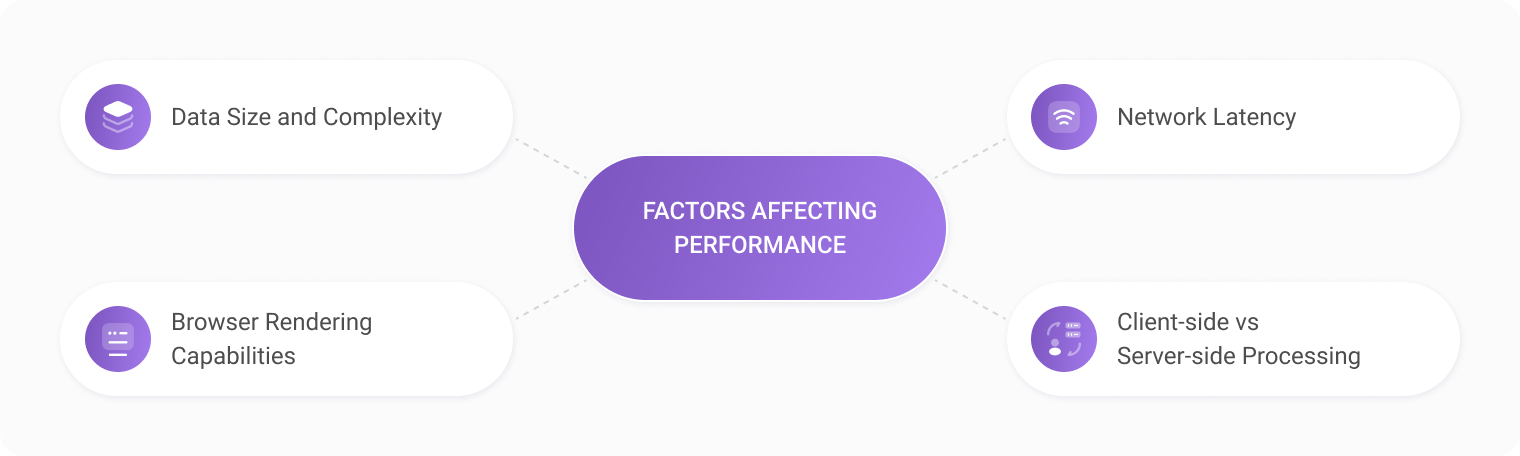
Data size and complexity
Modern enterprises uninterruptedly produce huge amounts of data – be it e-commerce, healthcare, manufacturing, logistics – the quantity of data generated by businesses is going up rapidly. But there is one more issue – increased data volumes go hand in hand with the growing complexity of datasets. The greater the amount and complexity – the more optimized tools we need to avoid delays in data representation. The factors described above demand reliable solutions that can cope with loading and display of complex datasets with no need to update your app in case of dataflow upsurge.
Browser rendering capabilities
When dealing with large amounts of data that need to be rendered, we can’t leave unaddressed the matter of the limited size of the browser container. Each browser has its own pixel limit we can’t exceed – in case we go beyond we run into data rendering issues. It means we need to cover all the bases when designing application architecture and make sure it includes a practical solution to tackle the problem.
Client-side vs. server-side processing
There are two ways of data processing – client-side and server-side, depending on whether all the manipulations with data are handled directly in the browser or on the server. They both can be applicable when we work with tables containing datasets of varying complexity and have their benefits and drawbacks.
In case of the client-side processing the client-side receives the whole amount of data and all the manipulations with data are controlled locally, typically within a data model. This approach ensures seamless user experience as no additional requests are sent to the server. At the same time if we chose it for loading large datasets, we are highly luckily to deal with performance problems.
In case of the server-side processing all data operations rely on server response. The JS data grid you integrate into your app requests data subsets from the server based on user manipulations and receives all the needed data. While the client-side processing makes a good showing in working with small amounts of data, the server-side is more preferable for large amounts of data as it fixes client-side performance issues as well as provides the possibilities for handling challenges imposed by browser rendering limits.
Network latency in remote data fetching
When we use dynamic loading for populating our app table with data – i.e. data grid responds to the user behavior, sends requests to the server and receives the corresponding information in chunks – network latency is one more aspect we need to be mindful of. Network latency refers to remote data fetching and reflects the amount of time needed for the specific data package to make a roundtrip from the client to the server. The lower the latency – the better it is for our website or app performance. There is a list of factors influencing it, but the key of them refer to the physical distance your dataset has to travel, the transmission medium and the size of the data chunk your table receives. Keep track of them to avoid high latency (high lag time) and inefficiency in real-time business processes as a consequence.
Best Practices for Optimizing JS DataGrid Performance
In the previous section we focused on the major factors that influence our app or website performance, so now let’s pass on to the no less important issue of how performance can be optimized. We are going to revolve about efficient data handling, minimizing DOM manipulations and caching strategies.

Efficient Data Handling
- Use of pagination to limit data load. When we deal with big amounts of data and try to download the entire dataset without dividing it into small-sized packages, sooner rather than later we will run into performance issues. The server will take too long to resolve incoming requests and your app or website speed will dramatically go down. If the datasets you work with are large enough use pagination, i.e. split them in chunks that can easily be fetched and displayed without performance losses.
- Lazy loading and infinite scrolling techniques. Lazy loading technique allows us to receive from the server and then render only the data that are needed at the moment, or to put it differently, we postpone the loading (sending the request) of the next portion of data until the user scrolls to nearly the end of the previously loaded one. When we use infinite scrolling the request for the next dataset is sent as soon as the user reaches the bottom of the grid. The two techniques help reduce page loading time and can be used alternatively to pagination to improve performance.
Optimizing DOM Manipulation
- Using virtual scrolling for large datasets. In terms of user experience virtual scrolling is similar to infinite scroll, but technically it is closer to pagination. When you implement virtual scroll, you have a dataset of a certain size in memory and render a fixed amount of DOM elements that does not increase.
- Reducing the number of elements rendered. Use pagination, lazy loading, infinite or virtual scrolling techniques to cut down the amount of DOM elements your app or website needs to render. Thus, your performance will definitely go up and your code will be divided into smaller modules that can be processed and rendered much faster.
Caching Strategies
Implementing caching mechanisms for frequently accessed data. Utilizing caching mechanisms is one more technique that can significantly influence your project performance. Cashing consists in storing in cache copies of data the user accesses more frequently. So, when the user opens a website, it is loaded faster as some of the files are now stored locally and are not needed to be downloaded from the server.
Handling Millions of Rows with Webix JS DataTable Library
Modern websites and applications often need to support huge amounts of data or better say they need to have a solution for handling big data by design – to make sure nothing goes wrong in case the quantity of information your project receives rockets with the course of time. As a result we face quite a list of challenges when trying to meet the demands of the modern world with its ever-increasing data flows. We need solutions that provide optimized performance, high rendering speed, business operations accuracy and positive user experience in working with large datasets. Fortunately, we already have a carefully designed solution to face all these challenges.
Webix DataTable is a data management solution that complies with the above-mentioned requirements for the effective management of big datasets, what’s more, it’s a ready-made component that can easily be incorporated into your website or application. How does it achieve such a high performance rate working with big data? Let’s dive in.
Webix DataTable uses a lazy drawing strategy to manage huge amounts of data, which means that the widget renders and includes into the DOM only a limited amount of items (only visible elements), so the drawing speed is always at one and the same level. As a result, you do not need to care about how many rows your table contains – be it 100 or 100000 (you are not limited here) – you do not overload your grid with data and do not run into performance issues, as your app renders only a fixed amount of records.
Dynamic rendering works the same irrespective of whether the user utilizes:
- a scroll only;
- pages with a fixed and small number of records without a scroll;
- pages with a scroll (e.g. 100 records per page).
In all the cases described above data rendering follows one and the same scenario – only visible elements are included into the DOM.
There is one more notable feature of Webix DataTable – it has an in-built mechanism to successfully tackle browser rendering limits we have mentioned earlier in this article. The widget renders the related data chunk (a certain number of rows) and a scroll UI separately which allows to resolve the aforesaid browser issue. You can take the advantage of this feature without any additional API calls or your app modifications as it is available by default.
Competitors’ DataGrid Performance Review: Rendering Records
You can find below a graphical chart illustrating how Webix JavaScript DataTable deals with rendering rows if compared to other data management solutions. As you can see Webix demonstrates the best performance regardless of the dataset size. This means Webix JS DataGrid efficiently renders your data, no matter how large your dataset is, ensuring consistently excellent results.
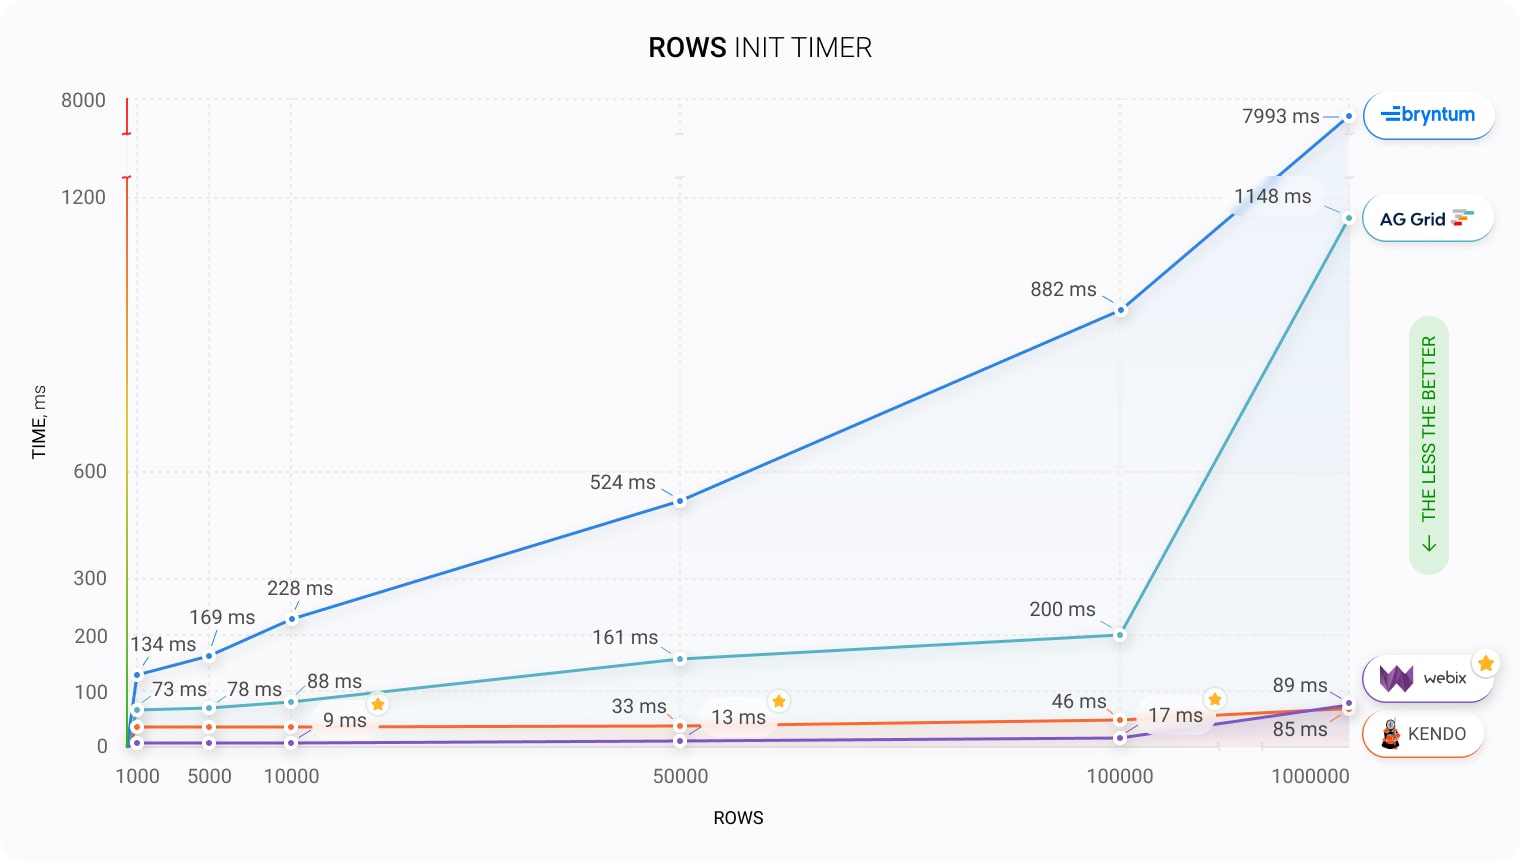
While carrying out the above and the subsequent performance comparisons the following conditions were observed to make them as fair as possible:
- the data table initialization speed with previously generated local data (the same dataset) was measured;
- default and simple data table settings were used (no complex data templates, no added complexity to columns configuration – sizes only);
- the measurements were taken based on timestamps of the performance.now() method.
Please, note that the figures can differ depending on the device and browser you use for estimations (performance evaluations in this article were made in Chrome web browser and on a device with 16GB RAM ).
Managing Thousands of Columns with Webix DataGrid
We have just discussed how millions of rows can easily be handled with the help of a lazy rendering strategy introduced in Webix DataTable, but is there a proper solution for resolving DOM overload and performance issues when it comes to columns?
Although a vast number of columns is not very common, we can find ourselves in a situation when the table we need for describing our business processes contains quite a number of them. Nevertheless, if we start searching for the efficient column rendering instrument we will find that it is not a low-hanging fruit to pick.
Good news is that Webix comes up with an excellent solution for this tricky situation. Webix DataTable provides the possibility to apply lazy rendering not only in case of rows, but columns as well. This unique option created by Webix developers allows to render visible columns and remove from the DOM those that are no longer in the view. As a result, you do not need to worry about performance and the amount of columns your app has as only visible ones are rendered.
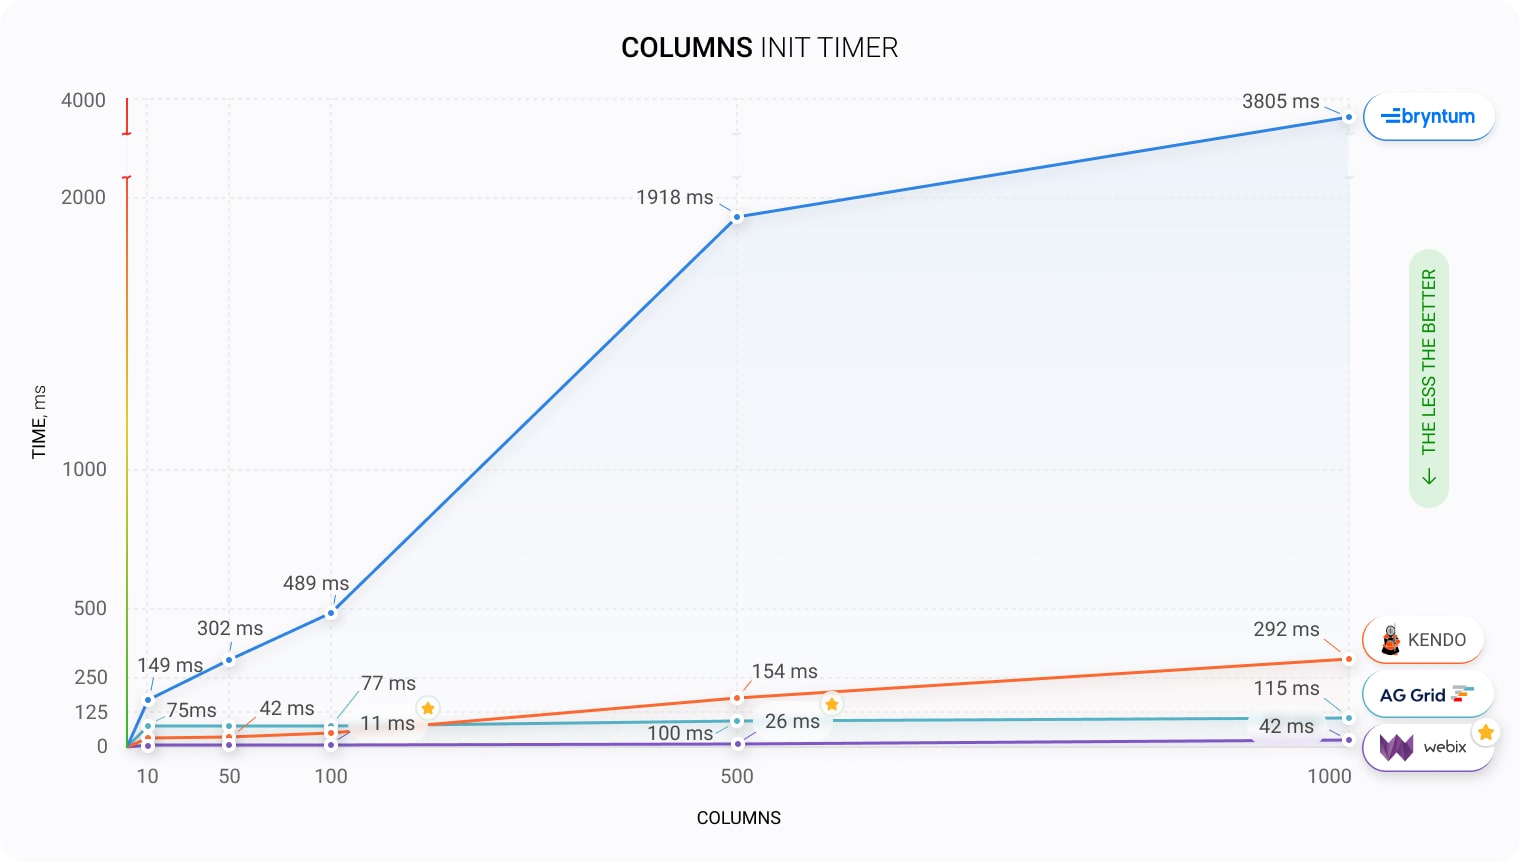
Competitors’ DataGrid Performance Review: Rendering Columns
Let’s study a graphical chart demonstrating Webix JavaScript DataTable performance compared to other data management solutions when it comes to rendering columns. The chart shows Webix advantage reflected in consistently high rendering speed no matter how many columns you have. By integrating Webix JS DataGrid widget into your project, you gain access to a cutting-edge, powerful tool that effortlessly handles any number of columns. This means you can effectively manage both columns and rows without any concerns, thanks to this modern, ready-made solution at your disposal.
Optimizing for Touch Devices
Webix DataTable demonstrates high performance on all devices – whether it be your laptop with a desktop browser or any of the touch screen devices with a touch browser. Thanks to lazy rendering you do not need to worry about the quantity of rows and columns your table has. Nevertheless, there is one thing you need to be aware of when considering using lazy rendering on touch devices – Webix DataTable renders the data and the scroll UI separately and receives a new scroll position upon completion of a touch action. Only after that a new amount of data is rendered on touch devices.
As we need to wait for the touch action to complete and only then we can see new data rendered, scrolling looks not as smooth as the native one, but this mechanism guarantees high performance.
So, in case of touch browsers you have two options – you can use lazy rendering with all the benefits of working with huge amounts of data, but without native smoothness of the scroll, or you can switch to “prerender” mode for Webix DataTable for smooth scrolling, but face your browser and device limitations for big data rendering.
Dynamic Loading
We have already discussed dynamic rendering – it significantly speeds up data visual display after loading, as well as your further work with data. At the same time using a single request for loading millions of rows or thousands of columns – is too much and too slow – so we can’t help mentioning dynamic loading as no less important instrument for data management.
Dynamic loading means that your grid receives the data in small chunks upon requests to the server. You can use this technique in DataTable to dynamically fill it with records. As you scroll the table new requests are sent to the server and the grid receives the corresponding data (the required rows). While dynamic rendering removes the elements we do not need at the moment from the DOM, dynamic loading caches the already loaded data into the table store to have immediate access to them.
Dynamic loading together with dynamic rendering can significantly facilitate performance gain taking care about all the technical details of working with huge amounts of data.
Conclusion
In this article, we discussed in detail all the challenges that arise when our website or application deals with fast-growing data flows it has to manage. We delved into factors affecting performance and dived into the best practices to optimize it – all for the sake of finding the best suited solution for working with big data.
We considered in detail the advantages provided by the Webix DataTable for managing big data – lazy rendering of rows and columns in desktop and touch browsers, dynamic loading as well as preloading data for smooth scrolling. All these features are designed to considerably facilitate your interaction with big data and take care of the possible performance issues that can occur when your app faces excessive data flows.
Check our customer’s showcase demonstrating how Webix DataTable can be integrated into a solution for accessing and using databases in the construction industry. DataTable implementation helped manage the incoming data from different sources and ensure transparency of building processes.
Hope this article will encourage you to explore Webix DataTable and carry out even a more in-depth investigation of all the opportunities of the widget your project can benefit from.