WEBIX JAVASCRIPT LIBRARY BLOG

UI development best practices, front-end programming tips and news to speed up your Web development.

Follow us:

Write for us: learn about our guest posts guidelines.

Understanding Component Data: DataStore and TreeStore

Hey all! Can you already smell the autumn in the air? Alas, the fruitful summer gradually comes to an end, and it’s time to receive a Bachelor’s degree in Webix 🙂 Today I suggest you to brush up your knowledge of data components by uncovering one of the base concepts – DataStore. In the article below you will learn what is hidden behind visual presentation and may pick useful snippets for working with data.

heading

Save space, show more – Multiview and Carousel widgets

While football players are restricted by the field area (watching the championship, eh?), web developers compete with each other in an even smaller battlefield called viewport. And the one wins who manages to occupy every inch of it wisely.

carousel widget vs multiview


Still,  you can always add one more layer  to your application and choose content you’d like to show first. No doubt, Webix is always at hand with ready-made solutions for multiple-view layouts:  

  • Accordion widget
  • Carousel widget
  • Multiview widget

Life is not on Instagram, let us choose Organogram

I remember my school years and those long evenings spent by painting a family tree. It was the first time in life when I faced the inevitable consequences of a poorly planned work – the sheet of paper unexpectedly came to an end and I had to redraw the scheme from the very beginning. That was a fail!

Organogram


Time has passed and new technologies stepped into our lives offering a number of tools for that trivial task. I also saw that the big world is built around the same hierarchical schemes used everywhere: from simple IT org charts to multi-department companies’ hierarchy.

And although there’s a number of tools for manual drawing of organograms, drawing itself is no longer needed. Now I can simply pass the data into a cute Webix organogram widget and feast my eyes upon the ready-made chart in the browser!

No magic, just code (and Webix Pro):

Webix TreeMap – Power of Visualization

Webix offers a number of possibilities to nicely visualize linear data – bar, pie, area, scatter and radar charts – to match any use case. But what can be done if hierarchy matters?  You may think of a Webix Tree as the first and foremost widget as it perfectly shows parent-to-child relation. But that’s almost all about its visualization abilities.

For more powerful tools we should look into the PRO package that includes Organogram (a tree-like diagram ) and TreeMap. We will pay a closer attention to the Webix TreeMap as it is the only Webix widget that can display hierarchical data on a proportional  basis.

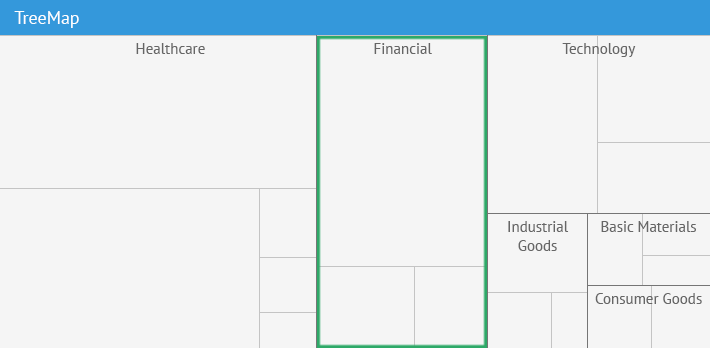
The simplest initialization code is brief:

webix.ui({
     view:"treemap", value:”#value#”,  
     template: function(item){  return item.label||""; },
     data:data
});

And you get the following output:

TreeMap_Basic

1 9 10 11 12 13 19