Autumn 2021 has handed its power over to winter. Let’s recall what this autumn was noted for.
Webix Autumn Follow-Up 2021
November 30, 2021
The main fall release of 2021 was marked by a number of important updates to the Webix library. Among other changes, a special place is kept to a deep update of one of the complex widgets of the library. And this article is dedicated to the flagship of the 9.0 release, namely, the new Webix JavaScript Pivot widget. Let’s figure out what has been changed and how the updates affected the functionality, interface and code in general.
If you want to add JavaScript charts with main Pivot Table functions to your web app, you can use Webix Pivot Chart. This powerful component shows data series, categories and chart axes the same way a widget JavaScript Charts does and provides you with interactive filtering controls for quick dataset analyzing.
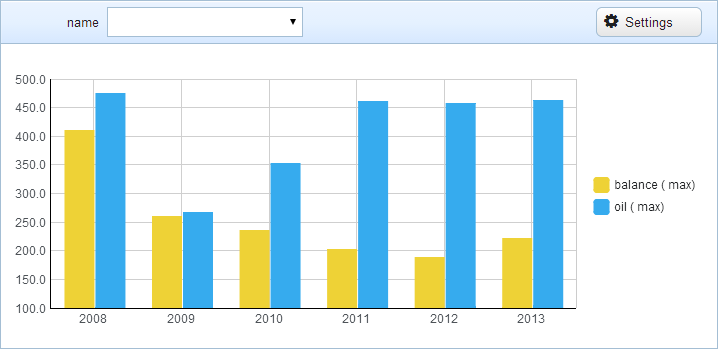
Pivot Chart delivers various types of charts: line and spline chart, area chart, bar chart, pie chart, 3d pie chart, donut chart, scatter chart, and radar chart.
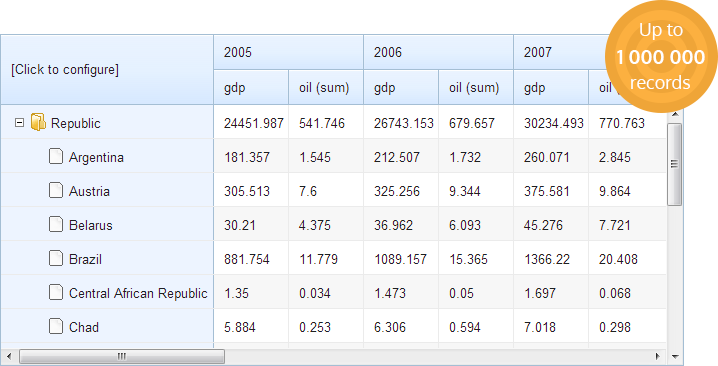
Everyday millions of employees have to analyze complex data, create reports. Pivot table is a perfect web solution for those professionals who work with huge amounts of data.
Learn about our guest posts guidelines