TL;DR: Reviewed and compared five best MIT-licensed open-source JavaScript Gantt charts – DHTMLX Gantt Community Edition, SVAR React Gantt, Frappe Gantt, gantt-task-react, and ngx-gantt – outlining their strengths, limitations, and ideal use cases.
Everyone has heard the same warning on repeat “AI is coming for junior devs.” The rules are changing faster than anyone expected. You can dislike it or ignore it, but AI is already reshaping the job landscape for developers. Yet before we jump to conclusions about being “replaced”, we decided to ask those who actually feel the change in their daily work. Developers who left the junior stage behind years ago and grew into mid and senior engineers. We asked Webix developers a few bold questions about what really happens to their workflow now that AI is fully in the picture.
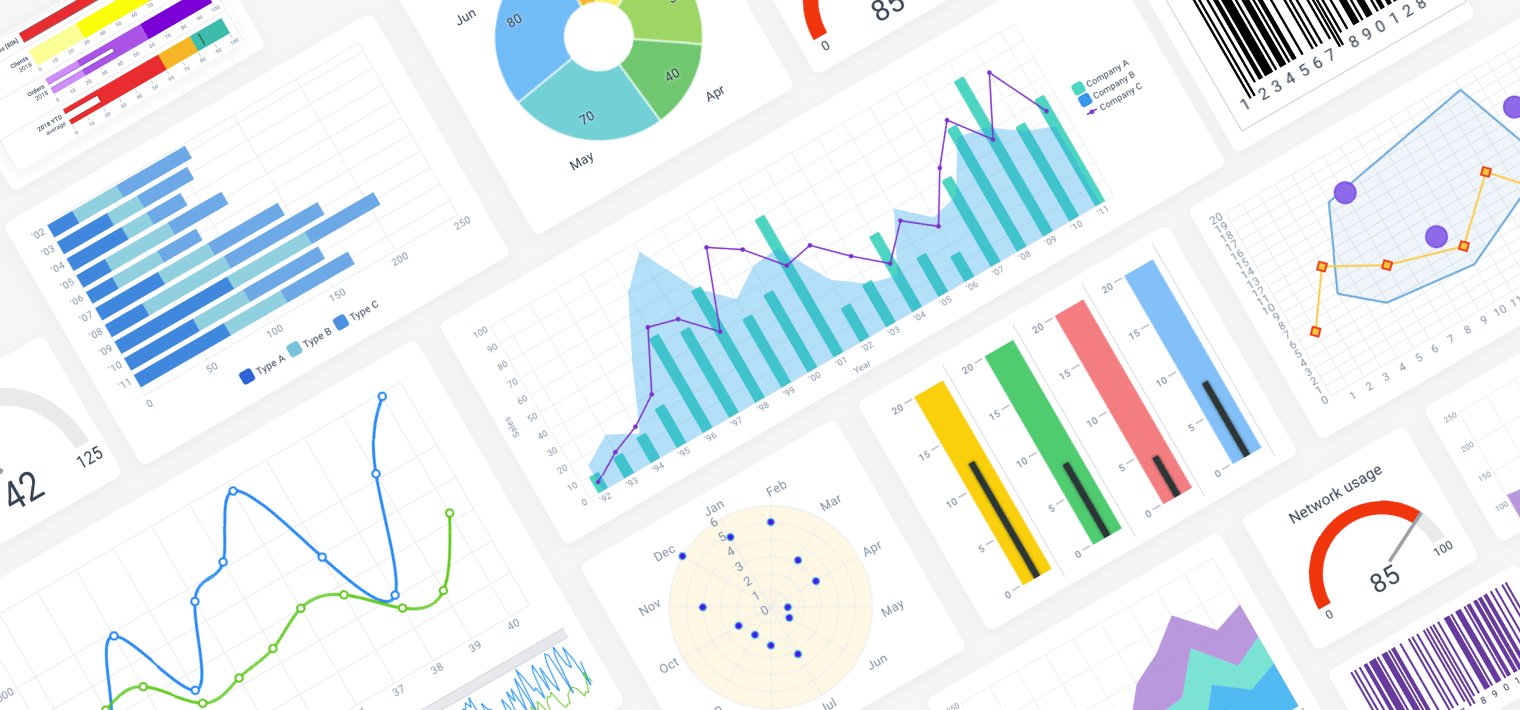
In today’s world, where insights need to be fast, interactive, and user-friendly, developers and analysts turn to data visualization tools that deliver meaningful, real-time data in visually intuitive formats. Looking for an easy way to visualize data effortlessly and with high performance? Check out these 5 best data visualization tools that are available in Webix JavaScript components.They are designed to help you build clear, informative visualizations and analytics dashboards in no time.
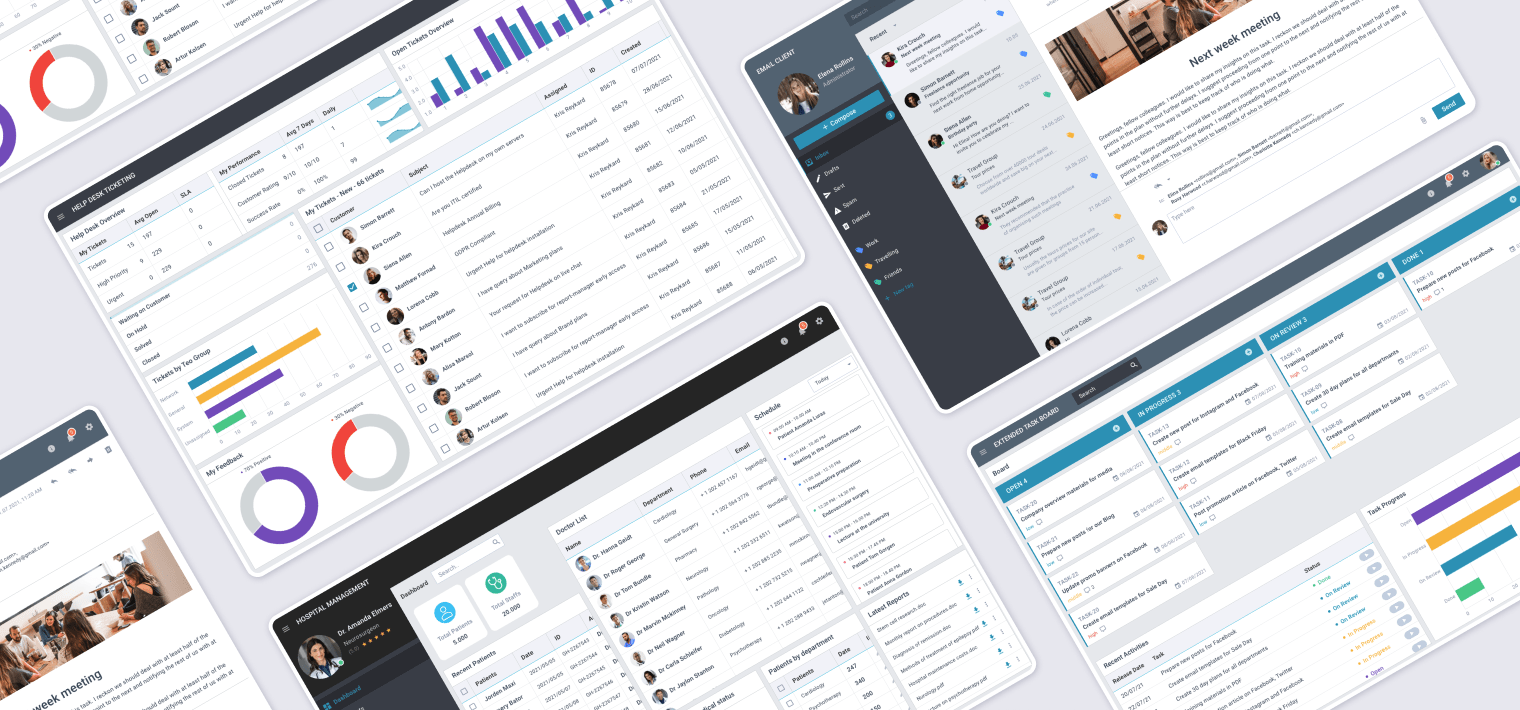
In the era of digital transformation, businesses are continually seeking effective ways to build, display, and manage complex datasets in web applications. Webix is a JavaScript UI framework designed for enterprise data management and the development of complex, data-driven web applications. Adopting Webix allows cutting UI development time by up to 30%, while delivering production-ready data interfaces.

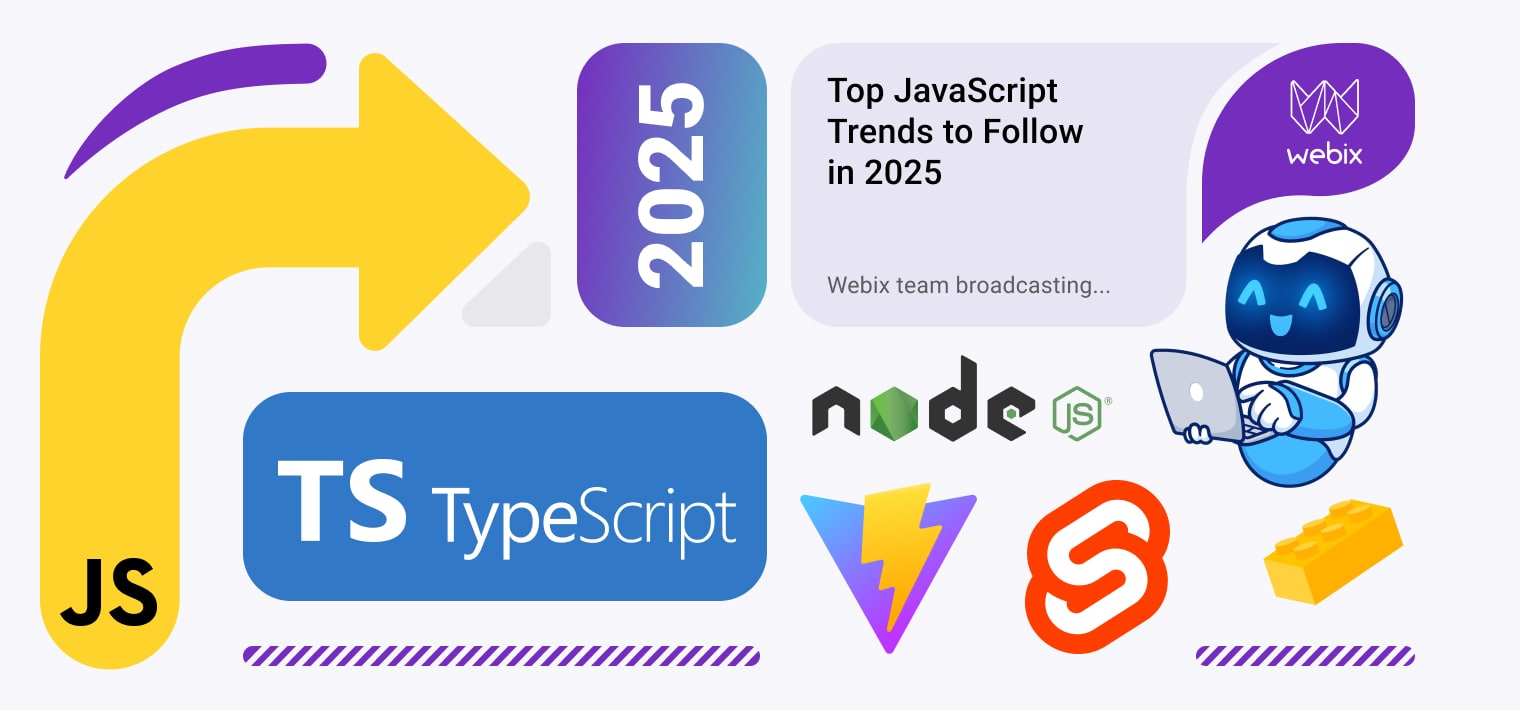
Today we invite you to have a closer look at JavaScript trends in 2025 and make predictions about which of them will determine the near future of web-development. When it comes to forecasting the future we unwittingly start thinking about where to get some magical means for predicting it. And it is a great pity we don’t have any, isn’t it? Not really. We have something far more valuable – our expertise that helps us make precise and reliable technology forecasts.

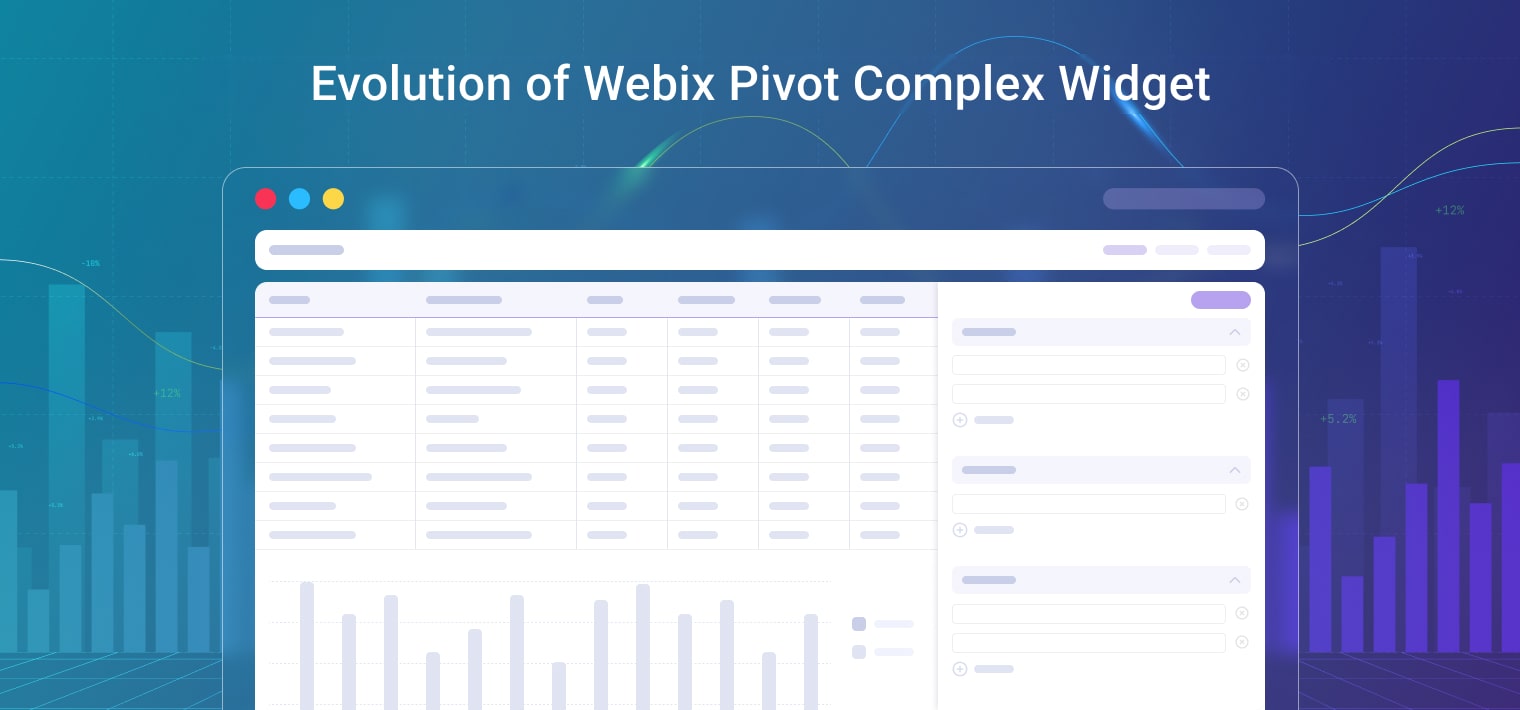
We continue our series of articles on the evolution of Webix complex widgets and today we are going to plunge into the history of the Webix JavaScript Pivot Table – elaborating on the major changes the widget has undergone and the enhancements it is constantly receiving to ensure the users are provided with a wide range of possibilities facilitating their interaction with data.

Updated September 2025
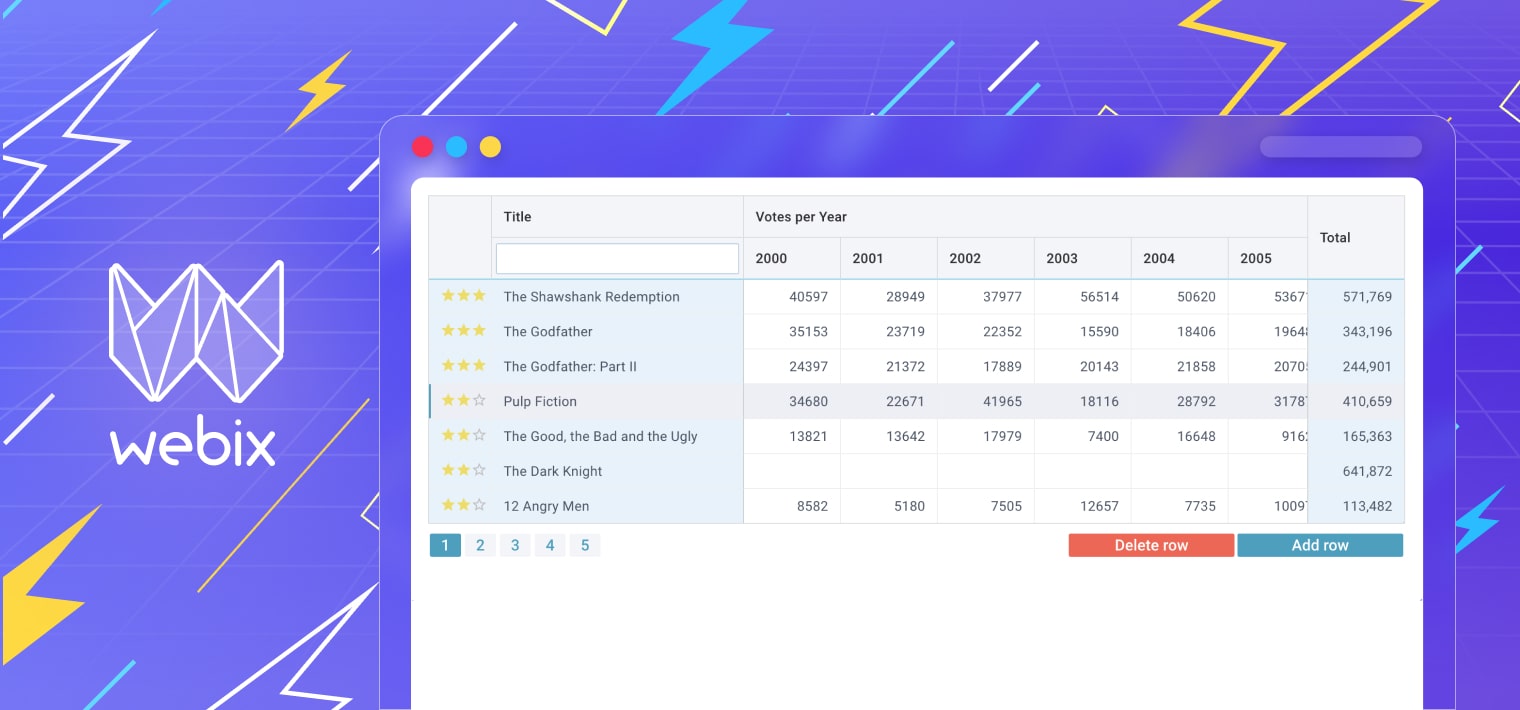
The implementation of robust solutions for handling large quantities of data has become a new norm for web application development. The exponential growth of data can be quite a challenge as the tools we utilize should ensure data availability, high processing speed and provide against delays or inconsistencies. As large datasets are often used in advanced analytics, business intelligence and statistics – minor downtime can cause major issues. Today we are going to carry out an in-depth analysis of Webix JS DataTable – a cutting-edge solution for managing extensive data efficiently.

When we start building an app or a website, we are usually challenged to choose the right tool for our context. This task becomes even more complex in view of a wide variety of JavaScript libraries and frameworks web developers have at their disposal in addition to the possibilities coming with programming in Vanilla JavaScript.