Reading time: 6 mins
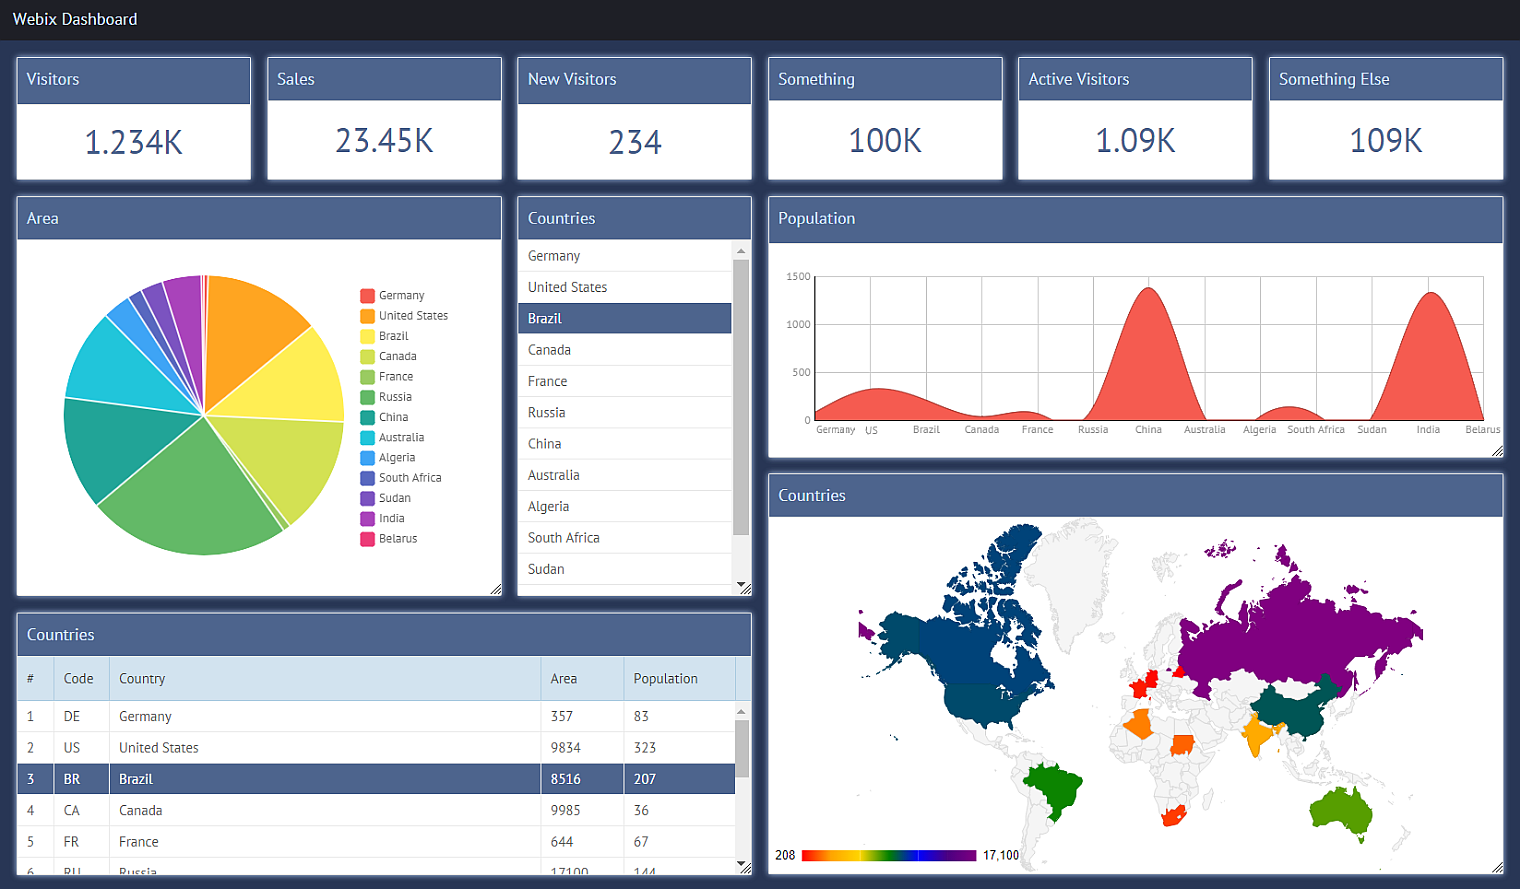
Dashboards are good for tracking important information. With Webix Dashboard, you can conveniently place components in a grid and let users change the structure of the application with drag-n-drop. Dashboard panels in a dynamic layout can be rearranged, resized, removed and created anew. Join me to find out how Dashboard can help you create dashboards for apps.
Step 1. Simple Responsive Dashboard with Drag and Resize
Initializing Webix Dashboard Layout
Dashboard is available in Webix PRO. So for your projects you will have to include Webix files from your local folder, e.g. “../codebase/webix.js”.
Let’s initialize Dashboard. By default, it will have 2 rows and 2 columns:
view:"dashboard",
id:"grid"
});
Creating and Configuring Panels
Let’s place the first panel with a widget onto the dashboard. This is a panel with GeoChart that is placed in the bottom right cell of the dashboard:
view:"dashboard",
id:"grid",
cells:[
{
view:"panel",
x:1, y:1,
dx:1, dy:1,
body:{
view:"geochart", data:data,
chart:{
colorAxis:{
colors: ["red","orange","gold","green","blue","indigo","purple"]
}
}
}
}
]
});
Drag the panel into one of the upper cells:
I can also add a header or an icon to a panel. To make the panel resizable, I’ll add resize:true to the panel configuration.
view:"panel",
x:1, y:1,
dx:1, dy:1,
header:"Area World Map", // or icon:"mdi mdi-menu" (FA icon:"fas fa-bars")
resize:true,
body:{
view:"geochart", data:data,
chart:{
colorAxis:{
colors:["red","orange","gold","green","blue","indigo","purple"]
}
}
}
}
Building a Responsive Dashboard Layout
I will create an 8×6 dashboard. Sizes of the grid are set as gridColumns:8, gridRows:6 in the Dashboard configuration. Let’s add more panels, e.g.:
view:"dashboard", id:"grid",
gridColumns:8, gridRows:6,
cells:[
{
view:"panel", x:1, y:0, dx:1, dy:1,
header:"Visitors",
body:{
template:"<p class='title'>1.234K</p>", css:"draft"
}
},
{
view:"panel",
x:1, y:3, dx:1, dy:2, resize:true,
header:"Countries",
body:{
view:"list", id:"list",
template:"#country#",
data:webix.copy(data),
ready: function(){
this.select(3);
}
}
}
]
});
I will also add padding for the dashboard and margin for each panel:
view:"dashboard",
id:"grid",
gridColumns:8, gridRows:6,
padding:18, margin:18,
cells:[
//...cells
]
});
For the demo, I used the Flat skin with different colors.
Let it Scroll
You can create dashboards with scrollbars.
You can do this by setting fixed height of cells with cellHeight. There is a side effect: panels can be dragged lower than gridRows. The existing panels won’t shrink vertically, and the dashboard will still be responsive. Let’s place the dashboard into a scrollview:
view:"dashboard",
id:"grid",
cellHeight:200,
gridColumns:8, gridRows:6,
padding:18, margin:18,
cells:[
//...cells
]
};
webix.ui({
rows:[
toolbar,
{
view:"scrollview", body:grid
}
]
});
By analogy, you can create horizontally scrollable dashboards.
Step 2. Saving and Restoring Dashboard Layout State
It is useful to remember the arrangement of panels and restore it. This way users will not have to rearrange panels every time they open the dashboard again.
Move panels and reload the page:
Saving the State
I want the dashboard to save its state each time I move or resize panels. So I will attach a handler to the onChange event, serialize the state and put the state object into the local storage:
view:"dashboard", id:"grid",
gridColumns:7, gridRows:6,
padding:18, margin:18,
cells:[
//...cells
],
on:{
onChange:function(){
//saving grid state
var state = this.serialize();
webix.storage.local.put("grid-dashboard", state);
}
}
};
Similarly, you can save the state to the server.
Restoring the State
I will restore the dashboard state after page reloads. I will get the state object from the local storage and restore the state of the grid after the initialization of the UI:
webix.ui({
rows:[
toolbar,
grid
]
});
//restoring grid state
var state = webix.storage.local.get("grid-dashboard");
if (state)
$$("grid").restore(state);
Now if you move or resize panels and then reload the page, the dashboard will be rebuilt as before.
Step 3. Dragging New Panels from the Sidebar and Deleting Panels
Let’s give users even more freedom in configuring the dashboard. I will create a list of different panels and put them onto a sidebar. I will make it possible to drag panels from the list to the dashboard.
Each item in the list should contain a unique ID, the name of the item, and the number of rows and columns that the widget will span within the grid. For instance, this is an item for a gage:
Check out the list of widgets. You can only drag items from it (drag:”source”). template defines the way widget names will be displayed: with their initial sizes.
rows:[
{
view:"list",
id:"list",
width:250,
drag:"source",
scroll:false,
template:"#value# (#dx#x#dy#)",
data:[
{ id:"visitors_template", value:"Visitors Template", dx:1, dy:1 },
{ id:"sales_template", value:"Sales Template", dx:1, dy:1 },
{ id:"area_pie_chart", value:"Area Pie Chart", dx:2, dy:2 },
{ id:"population_spline_chart", value:"Population Spline Area Chart", dx:3, dy:2 },
{ id:"network_usage_gage", value:"Network Usage Gage", dx:2, dy:2 },
{ id:"countries_list", value:"Countries List", dx:1, dy:2 },
{ id:"countries_datatable", value:"Countries Datatable", dx:2, dy:2 }
]
}
]
};
Dashboard Panel Factory
To work with dynamic panels, I need to define the factory function. The factory will receive the attributes of a list option (a name and rowspan/colspan) and build a panel according to it. The function receives the state object and must return the Webix UI configuration of the widget.
Each panel will be created by a separate function that will receive the state object and return it to the factory. For example, the factory will receive a list item with the ID “network_usage_gage”:
obj.view = "panel";
switch (obj.name){
case "network_usage_gage":
return createNetworkGage(obj);
//other cases
}
And createNetworkGage() will create a panel with a gage and return it to the factory:
obj.resize = true;
obj.body = {
view:"gage",
id:"g1",
value:36,
minRange:0,
maxRange:100,
color:color,
data:webix.copy(data)
};
return obj;
};
You can check the complete code of the factory in the GitHub repository.
Deleting Panels
Under the list of widgets I’ll place a button to clear the dashboard and start again:
type:"clean", rows:[
//the list
...
{
view:"button", value:"Reset",
click:function(){
$$("grid").clearAll();
}
}
]
};
clearAll() of Dashboard works fine if you intend to delete all the panels at once. It can also be useful to delete panels one at a time. I will add icons to each panel for that – an x icon, which goes by the name fas fa-times in the Font Awesome collection:
obj.view = "panel";
obj.icon = "fas fa-times"; // icon:"mdi mdi-close"
//...
}
After that, I will define a click handler that will remove the panel. To make deleting less accidental, I’ll add a confirmation window.
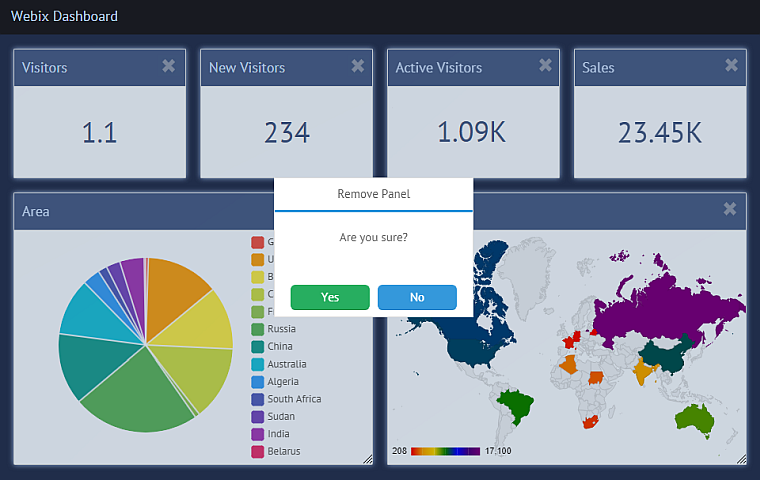
Panels are removed with the removeView method of Dashboard. On a click on the x icon, I will get the panel. If the dialogue returns confirmation, I will get the dashboard with the getParentView method of the panel and will remove the panel. This is the event handler that will open a confirmation window for removing a panel:
var css = ev.target.className;
//if the target is a panel icon, show the confirmation window
if (css && css.toString().indexOf("panel_icon") != -1){
var view = webix.$$(ev.target);
webix.confirm({
title:"Remove Panel",
ok:"Yes",
cancel:"No",
text:"Are you sure?",
callback:function(result){
if (result)
view.getParentView().removeView(view);
});
}
});
Conclusion
Webix Dashboard Layout is a JavaScript layout widget that helps to present data in a fully customizable and dynamic way. Dashboard is good for dynamic layouts that users can configure themselves. You can download the demo, extend it and use for your projects created with Webix PRO.
For more details on the widget, read the documentation. Webix Dashboard is based on GridLayout, Dashboard’s parent without drag and drop, also available in the PRO version of the library.