Sir Ranulph Fiennes, a British explorer and writer, once said: “There’s no such thing as bad weather, only inappropriate clothing.” You may, of course, check the window to see if you need to put on a raincoat. But this is a bit old-fashioned, isn’t it? Today there are a lot of modern weather apps. They allow you to decide quickly and easily whether to take an umbrella with you in the morning or not.
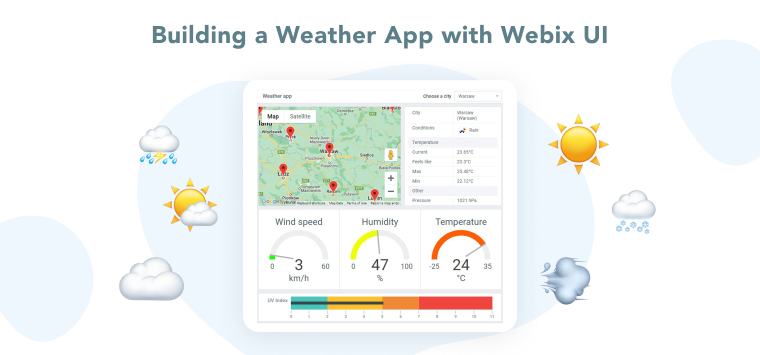
Today, I’ll show you how to build a JavaScript weather app using Webix UI components. You will be able to gather details about the weather in your city in one place. With just a quick glance, you can spot the temperature, humidity, wind speed, and UV index. A closer look will reveal the meteorological conditions, daily temperature range, and air pressure.
This app is a great example of how Webix PRO widgets can be used to build a data-rich weather application. Webix Pro offers a variety of HTML5 web widgets that are not included in Webix Standard. They all have their own distinct features and enhanced functionality. Our weather app is also an example on how to integrate a Google map into an app. If you are interested to learn more about such an app, keep on reading.
You can find Weather App Live Demo here.
Weather App Overview
To start, we should pick which Webix widgets will best suit our requirements for weather data presentation.
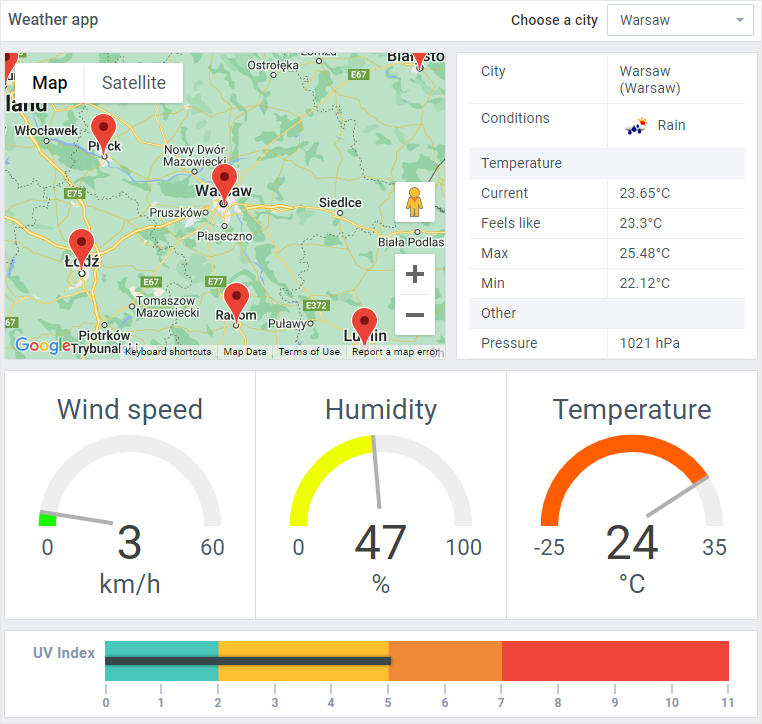
Clear and intuitive visualization is essential for any weather dashboard. To make important information stand out, let’s use two widgets from the PRO version: Bullet Graph (for UV index) and Gage (for temperature, humidity, and wind speed). As for standard widgets, Combo will help us to select a city from the available options. And Webix GoogleMap is a must for switching between cities. Finally, we will save information about the pressure, daily temperature range, and meteorological conditions in a Template.
To fetch real-time weather and UV data, we will use the OpenWeatherMap API and the OpenUV API. To get your own API keys, you should register at openweathermap.org and openuv.io. To use Webix GoogleMap widget, you should also get a personal Google API key.
In a browser, the app will look like this:
Preparing the Webix Environment
As I mentioned before, we will use a PRO version of the library to get access to a couple of widgets. You can install the library via NPM or download through the Client Area. Get your free trial version here if you don’t already have a PRO license.
Building the Weather App Layout
A quick reminder: every Webix component is a JSON object that contains all the attributes as key:value pairs. We can create the interface’s structure by arranging these components inside of one another. It’s worth noting that the interface is created using webix.ui() constructor that accepts a JSON object with a predefined layout.
The interface is divided into 2 horizontal parts (rows): toolbar and layout. In turn, the second row is divided into three rows. First one contains two columns implemented via the cols property: a map and weather conditions list. The second one is for gages, and the third one is for the bullet graph. In code it looks like this:
rows: [
bar,
{
rows: [{
cols: [
map,
mainStats,
]
},
gages,
UVbullet
]
}
]
});
For convenience each widget is stored in a separate variable to make the overall interface easier to read.
Let’s now look at how to create the necessary interface components to deliver the previously stated features.
Creating a Toolbar with City Selection
To keep our list of cities we will use DataCollection – a view-less component that stores a collection of non-hierarchical data. In this collection, we will load data for Polish cities – an array of objects with names and coordinates:
"city": "Warsaw",
"lat": "52.2167",
"lng": "21.0333",
},
{
"city": "Kraków",
"lat": "50.0614",
"lng": "19.9372",
}, ...
];
const cities = new webix.DataCollection({
data: pl
});
Later we will add this DataCollection as a value for data property for the combo and map.
On the toolbar we are going to place the name for our app and a dropdown list of cities. Let’s make three columns: the first one is a label, the second one is a spacer (it is placed here for design purposes), and the third one is a combo.
view: "toolbar",
cols: [
{
view: "label",
label: "Weather app"
},
{},
{
view: "combo",
label: "Choose a city"
}
]
};
It is nice to have an ability to filter options for city names. Since by default combo is filtered by value property, we need to redefine filtering by adding our own filter function.
view: "combo",
options: {
filter: function(item, value) {
const city = item.city.toString().toLowerCase();
return city.indexOf(value.toLowerCase()) !== -1;
},
...
},
};
Integrating Google Maps into the Weather App
Next we will create a map that will show all cities with weather data (we have chosen only 20 for the demo). Let’s add the Webix Google Map, which we will configure just like any other component. It is defined like this:
view:"google-map",
key:"AIzaSyAi0oVNVO-e603aUY8SILdD4v9bVBkmiTg", // use your own key
id:"map",
zoom:9,
center:[ 52.2167, 21.0333 ],
data: cities
};
The map lets you find cities and get the weather overview by clicking on them. That’s why we load the collection we’ve created before – cities – into this map by providing it as the value of the data property. We can use the zoom property to set the initial map scale and the center property to specify an array of center point coordinates. In our case, it will be the coordinates of Warsaw.
Our app will work in the following way: when the user clicks on a marker, the app selects that city from the combo and displays the weather information. And if the user chooses a city from the combo list, the map shows that city and the corresponding weather information. To do this, we need to synchronize the map and the combo.
To set the clicked city name as a combo value, we create the selectCity() function. We are going to reuse this code, so it makes sense to create a separate function for this.
$$("select").setValue(id);
};
Here, we need to handle the onItemClick event of the map and call selectCity():
selectCity(id);
});
We will also add the code that will make the map show the right city when the combo option is selected, but we will talk about it later.
Visualizing Weather Data with Gauges
To display the weather info, we need to make three gages: one for temperature, one for wind speed, and one for humidity. Let’s use the one for the wind speed as an illustration since they all follow the same pattern:
id:"wind",
view: "gage",
minRange: 0,
maxRange: 60,
label: "Wind speed",
placeholder: "km/h",
};
We define maximal and minimal values using the maxRange/minRange properties. The placeholder property specifies the units of measurement.
Then we put all of our gages in one variable and organize them into three columns:
cols: [
windGage,
humidityGage,
temperatureGage
]
};
Displaying UV Index with a Bullet Graph
Moving on to the Bullet Graph. The idea is to create a scale with ranges colored in green, yellow, orange and red depending on the UV index value.
view: "bullet",
maxRange: 11,
scale: {
step: 1
},
bands: [
{
value: 11,
color: "#f0443d"
},
{
value: 7,
color: "#F18835"
},
{
value: 5,
color: "#fec02f"
},
{
value: 2,
color: "#47c6b9"
},
],
};
We use the maxRange property to set the maximal value for the UV index. The value of bands property is an array which contains the set of value and color values for ranges.
Showing Weather Conditions and Details
For the weather conditions list we will use a template component. When a new city is selected, we will parse the data and pass it to it. We are going to render a table with the weather conditions values. Here is a little trick: you won’t see standard HTML tags for tables, such as <table>, <tr> or <td>, in the application code. Instead, colons, rows, and cells will be rendered with the help of display:flex and custom CSS classes. You can take a closer look at the template code and style sheet in the live demo.
id: "mainStats",
template: obj => {
if (obj.weather)
return `
`;
}
};
Fetching Weather Data from External APIs
Moving on to where we will get our weather data.
We should first get an API key from the OpenWeather website to make API requests for weather data. Then, using the getWeather() function, we send an AJAX request with the latitude, longitude, and API key parameters to api.openweathermap.org. Our request will return a promise. If a call was successful, we will receive the data, which will be converted to JSON by the callback function. If something goes wrong, .catch() will notify us using webix.message() within the callback function for errors.
function getWeather(lat, lon) {
return webix.ajax()
.get(`https://api.openweathermap.org/data/2.5/weather?lat=${lat}&lon=${lon}&appid=${apiKey}&units=metric`)
.then(data => data.json())
.catch(err => {
webix.message(“Openweather: Server side error, see console”, “error”);
});
};
The request for UV index data will be similar. Note that our API key is transferred here as headers rather than being included in the call itself.
return webix.ajax().headers({
'x-access-token':'67fc0055b6f99e711657641dceb207f' // use your own token }).get(`https://api.openuv.io/api/v1/uv lat=${lat}&lng=${lon}`)
.then(data => data.json())
.catch(err => {
webix.message("Openuv: Server side error, see console", "error");
});
};
Later we will call these two functions to get the necessary data from both servers.
Note that we do not use real API calls in our sample because we use free versions of the API and they have a limit on the number of calls.
Caching Weather API Data
It is worthwhile to implement caching so that we do not have to send the same requests again over a short period of time. For example, we can make a collection to store this cache:
data: []
});
After new data has arrived from the servers, we should add it to the cache. A city name will be the value of the id property, and the spread operator will copy data object:
Optionally you can save the data from the collection to session or local storage every time new data is received. For that use the onAfterAdd event of the collection with cache:
webix.storage.session.put("weather-data", this.serialize());
});
Binding Weather Data to Webix Components
Our goal is to have the map and combo show the selected city when a user clicks on a marker or chooses an option from the combo. All other widgets, in turn, will display relevant weather information for the selected city.
We’ve already synced the map and combo to some extent; now it’s time to finish the job. To accomplish this, we must write code that prepares the weather data and sends it to the widgets.
The onChange event of combo will trigger the execution of this code inside a function called setCityData():
view: "combo",
...
on: {
onChange(cityID) {
setCityData(cityID);
}
}
}
We first synchronize the combo with the map so that the map displays the chosen city:
...
$$("map").getMap(true).then(map => {
map.setCenter(
new google.maps.LatLng(parseFloat(city.lat), parseFloat(city.lng))
);
});
...
}
The next step is to send the weather data to the widgets.
I’d like to remind you that we made a cache earlier in the article. Before we send requests, we should check it to see if we’ve already sent them for a particular city. If this is the case, we send the data to the widgets from the cache. Otherwise, we should send requests to the servers.
... // synchronizing the map
const cache = weatherDataCache.getItem(city.city);
if (cache) {
setWeatherData(cache);
} else {
...}
}
We have two requests that should be sent simultaneously. So we use webix.promise.all to wait for both of them to be completed and then begin working with the data we received.
... // cache case
else {
const lat = parseFloat(city.lat);
const lng = parseFloat(city.lng);
webix.promise.all([
getWeather(lat, lng),
getUV(lat, lng)
]).then(data => {
const obj = {
...data[0],
uv: data[1].result.uv,
city: city.city
};
setWeatherData(obj);
setToCache(city.city, obj);
});
}
}
Let’s put both responses together into one object. Then we pass this object to the widgets. For this, we call a function called setWeatherData(). Inside it we set values for gages, bullet graph and weather conditions list.
$$("temperature").setValue(Math.round(data.main.temp));
$$("UV").setValue(data.uv);
$$("wind").setValue(Math.round(data.wind.speed));
$$("humidity").setValue(data.main.humidity);
$$("mainStats").parse(webix.copy(data));
}
Next step is to pass the same object to the setToCache() function. This action will add weather information for a particular city to cache:
weatherDataCache.add({ ...data, id:city });
}
To select some city from the start of the app, let’s call selectCity() after webix.ui():
And, as they say in Hollywood, that’s a wrap! We configured all the components and linked them with data from the servers. Now any user can find out the weather in a certain city with the help of a map or select the necessary one from the combo.
Conclusion
You can find a live demo here.
In this article, we demonstrated how to build a weather app with Webix UI, using components from both Standard and PRO editions, real APIs, and Google Maps integration.
Read here to learn more about the difference between Rro and standard versions.
If you have any questions, please share them in the comments section below. To read more about all possibilities of the Webix widgets with related samples, visit the documentation of the Webix library.