“Debugging is like being the detective in a crime movie
where you are also the murderer”. Filipe Fortes
Want to develop Webix-based apps wisely and efficiently? Tired of red-eye nights spent by the computer screen? Still feel pain after catching that naughty untrackable bug last week?
Then it’s high time to arm yourself with technology and knowledge. Today I am going to get you acquainted with debugging tools that Webix offers right out of the box.

Webix JS code for PRO and GPL editions comes in two versions, both of which are included into the package: the “webix.min.js” and “webix.js” files. They are identical in widgets’ features, but the version in “webix.js” offers extra functionality for understanding what is going on.
Important note: before Webix 6.0, the files were webix.js and webix_debug.js correspondingly.
Including debug version into the application
webix.js is a cosy private world of the human-readable source code, logging tools and error messages. It is unlikely that you want to let strangers (oops, I mean end clients!) into it, so normally developers go the following way:
- include the minified “webix.min.js” file into the production version of the application;
- include the rich “webix.js” file into the development version.
Please, don’t try including both files simultaneously, as it may cause unexpected mistakes.
There are several ways to start working with the debug version of Webix:
-
- Get webix.js of the latest GPL edition from Webix CDN:
-
- Get webix.js from the downloaded package or npm (either PRO or GPL – it depends on your license):
Digging the error stack
Let’s create a simple Webix Form with several inputs and buttons placed one below another:

Oh now, let it be a Fieldset instead of a Form. It features nice borders around and allows setting a label above:
view:"fieldset", label:"Collection",
rows:[
{ view:"button", value:"Add item"},
{ cols:[
{view:"text", label:"Item"}, {view:"icon", icon:"times"}
] },
{ view:"button", type:"form", value:"Save"}
]
});
But all of a sudden our expectations and reality diverge and we get a blank page! We enter the browser console hoping for the explanations, but all we can see there, is:

“Okay Google, what should I do with it?” Personally, I strongly dislike unexpected bugs in third-party tools. But I hope that after reading this article you will develop under Webix debug version and your console output will be less scary.
So let’s go back, include the webix.js file:
And hit the F5 button. Looks much clearer and comprehensive, isn’t it?

Firstly, we can easily trace the error stack and see that something went wrong right from the widget’s initialization. Secondly, a helpful text line is logged to warn us that a Fieldset widget must have a non-empty body.
Of course, we have missed that, unlike Form, Fieldset requires the body setting in its configuration! So, let’s define it to correct the code of our mini app:
view:"fieldset", label:"Collection",
body:{ //defining Fieldset body
rows:[
{ view:"button", value:"Add item"},
{ cols:[
{ view:"text", label:"Item"}, { view:"icon", icon:"times"}
]},
{ view:"button", type:"form", value:"Save"}
]
}
});
Hoorray!
Error messages to aid development
In the above issue with a Fieldset we could have also spotted the yellow popup with the same warning:

The debug version can talk to developers giving them human-readable instructions. It shows up yellow error messages for basic cases of improper actions within the Webix library, namely:
-
- Warns about the incorrect settings in widgets:

The correct DataProcessor configuration contains the pointer to the master data widget:
url: "/data/connector.php",
master: $$("grid")
});
-
- Informs about unsupported features in the current configuration:

The correct approach is using “server” sorting for dynamically loaded data. It triggers a request to fetch the ordered data from server:
view:"datatable",
columns:[ //sort “server” instead of “int”
{ id:"package", header:"Name", sort:"server" }
],
url:"data/data_dyn.php"
});
Informs about unsupported features in the current environment:

Webix widgets based on canvas are Chart, Organogram and Barcode. Basically, almost all browsers support canvas in this or that form, but if you encounter the one that cannot handle it at all, you will not be embarrassed.
-
- Gives hints on the origin of the mistakes:

The correct parameter for the showColumn method should be the ID of an existing and invisible column:
- And, the saddest one, warns a developer about an attempt to initialize a PRO widget under the GPL edition:

In this case you need to either use Webix PRO version or a GPL Calendar widget.
Note: If you are already frightened by the fact that end users will suspect you in writing poor code, do remember that these messages are absent in the minified webix.min.js.
Error messages: use case
Sometimes only error messages can help you understand what is going wrong.
Let’s proceed with our demo app and add the dynamics. Now we need an input that will appear in the layout on clicking the “Add item” button and disappear when the related “Delete” icon is clicked.
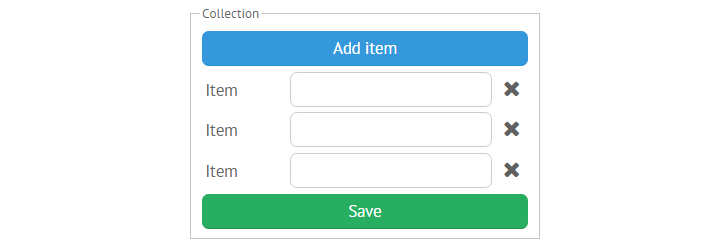
For these needs we can single out the repeated part:
{ view:"text", label:"Item"},
{ view:"icon", icon:"times", click:function(){
var line = this.getParentView();
$$("top").removeView(line.config.id);
}}
]};
Add use it in a layout with the “top” ID as well as pass it to the addView() method to clone it within the same layout:
view:"fieldset", label:"Collection",
body:{
id:"top", rows:[
{ view:"button", value:"Add item", click:function(){
var length = $$("top").getChildViews().length;
if(length<7) $$("top").addView(line, length-1);
}},
line,
{ view:"button", type:"form", value:"Save" }
]
}
});
The code executes flawlessly with a cleanest console log ever and everything goes smoothly until you try removing any text input: you can remove the last text input only. Neither messages, nor errors in the console. I can already hear your voice calling in the wilderness “WHAT am I doing wrong?”
In the debug version error messages would pop up on each attempt to add a new line:

It appears that although we do not specify widgets’ IDs explicitly, the reuse of the same configuration causes this duplication. Now we can figure out why the codeline
can remove only one input. After removing the first one, Webix considers other widgets with the same ID as already destructed and doesn’t even try to execute the command.
The solution is using unique IDs for each “input+icon” line. To achieve it, we need to make a full copy of the configuration object each time we want to use it: webix.copy(line).
So, the correct code of the demo is as follows:
view:"fieldset", label:"Collection",
body:{
id:"top", rows:[
{ view:"button", value:"Add item", click:function(){
var length = $$("top").getChildViews().length;
if(length<7)
$$("top").addView(webix.copy(line), length-1);
}},
webix.copy(line),
{ view:"button", type:"form", value:"Save"}
]
}
});
Now you can check the live demo and feast upon a working application. I guess this life hack has saved you a lot of time.
Inspecting Webix widgets
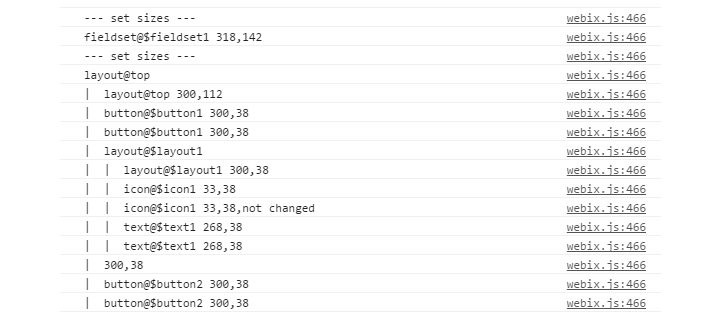
Have you noticed the strange IDs ( “$layout1”, “$icon1”, “$text1” ) on the above picture? They are automatically generated by Webix for widgets without explicitly defined IDs according to the following scheme: ${widget_name}{order}.
To learn the current ID of any widget on the page, you can activate a debug menu by a “Ctrl + right mouse click” action when hovering the desired widget.
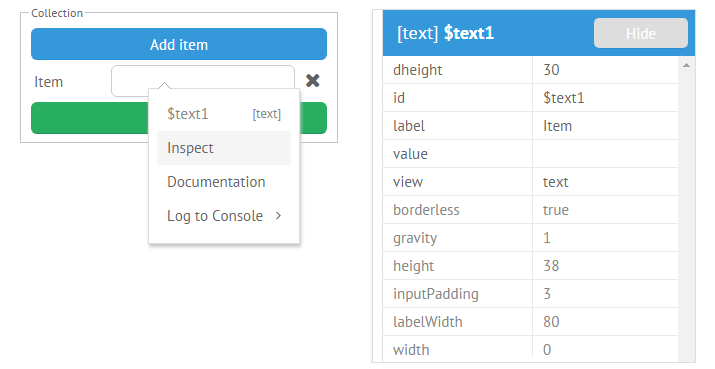
The menu not only uncovers the widget’s ID, but also allows inspecting and logging its parameters.
Logging processes in Webix world
Another logging possibility within the debug version can turn your console into a reality show.
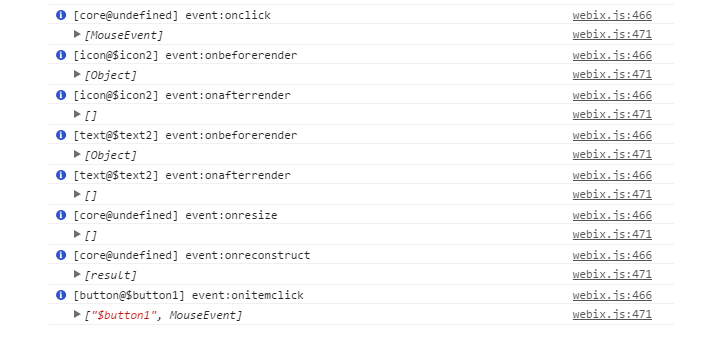
For instance, we can log events that are triggered for all the widgets in the app in the real time:
webix.ui({...});
Note: before Webix 6.0, you would write the following:
webix.ui({...});
Clicking the “Add item” button from the above mini app will show up the following event stack:
- Button is clicked
- Icon is rendered
- Text field is rendered
- Layout is reconstructed and resized
We can log all the widgets’ sizes as well:
webix.ui({...});
Note: before Webix 6.0, you would write the following:
webix.ui({...});
Here are the sizes from the above mini-app arranged hierarchically:
Before you go for a Friday beer…
… don’t forget to switch your production app to the webix.min.js back! 🙂
As you can see, Webix debugging tools can simplify your life a lot. I bet that studying their possibilities for 10 minutes can save up to 10 weeks of the estimated development time and help us build a friendly and bug-free universe together.
Don’t miss our article on different approaches to programming and GanttPRO showcase – the story from the team that used to work with Webix debug.


