Being keen on data management and visualization, Webix always stays flexible and open for interaction with other frameworks, so your creativity will never be limited. The UI library can easily welcome your favourite maps, text editors and visual data-driven tools like Sigma, Raphael and D3 charts in addition to JS Chart widget.
Although the integration of several JS libraries seems to be a challenge, you will not need to invent a bicycle, since basic integration patterns were created by our team long ago. Let us learn now how to develop visual interfaces by combining our UI framework with D3.js tools.
The ready-made integration code is located outside the main library package, in the repository of custom components on GitHub. In the related “d3” folder you will find the necessary adapter and the basic sample.
Creating reusable charts with D3.js
To start using D3 charts while developing Webix UI, you need to include the adapter right after the library’s script into the head section of your document:
<script type="text/javascript" src="./d3.js"></script>
The adapter adds a specific widget called “d3-chart” to the library collection, so the creation of D3 charts doesn’t differ from initialization of any other library’s widget. Let’s place a header and a D3.js data chart into a basic vertical layout:
webix.ui({
rows:[
{ type:"header", template:"D3 Chart"},
{ view:"d3-chart", url:data_url, ready:function(){
var svg = d3.select(this.$view).append("svg")
.attr("width", this.$width).attr("height", this.$height);
//further chart initialization code
} }
]
});
That’s it! Now, you have a working chart in your web app:
Live demo >>
Basically, Webix creates a container for an SVG D3 chart element to smoothly embed it into the application. It is accessible as this.$view in the ready handler of the “d3-chart” widget.
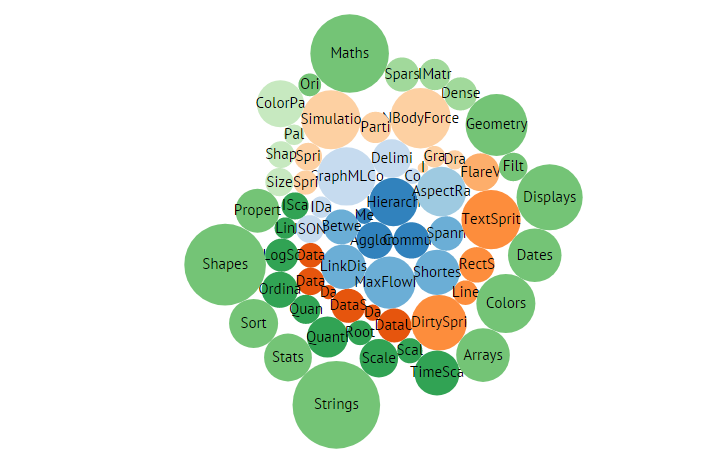
You can initialize any of the D3 charts (Bubble or Sunburst, etc.) within this container:
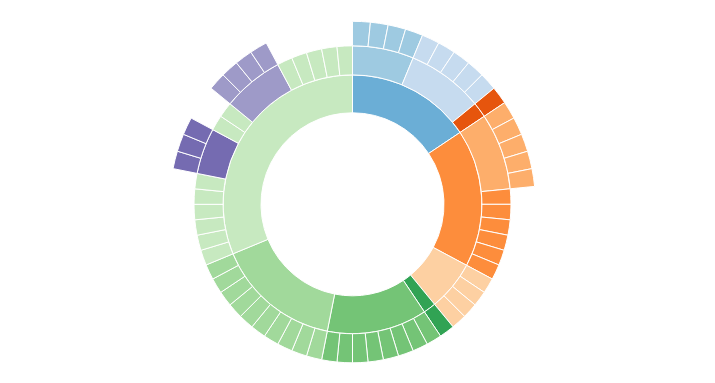
Live demo >>
Moreover, you can include several instances of D3 chart into the page, which highlights reusability of this custom widget:
rows:[
{ view:"d3-chart", resize:true, url:data_url, ready:function(){
//init bubble chart
} },
{ view:"d3-chart", resize:true, url:data_url, ready:function(){
//init sunburst chart
} }
]
});

The D3 charts can be made resizeable by the corresponding resize setting. In this case, the inner chart adjusts its dimensions each time viewport or container size changes. You can easily check it in the demo by dragging the resizer line between the two charts.
D3 Charts Integration Basics
If you want to learn what’s hidden in the black box, you can have a look inside the adapter (the code is distributed unminified) and admire its laconic and clear style:
name:"d3-chart",
defaults:{ … },
$init:function(){ ...},
$setSize:function(x,y){ /*resize inner d3 chart*/ },
_render_once:function(){ /*render d3 chart*/ }
}, webix.AtomDataLoader, webix.EventSystem, webix.ui.view );
This is a common pattern for developing Webix custom widgets. The protoUI constructor contains the following arguments:
- widget settings such as:
- widget name (later on it will be used as value of the view parameter);
- default properties (optional);
- private and public methods;
- the dependency chain, which includes all the modules this custom widget is based on.
The integrated D3 charts view inherits from the basic view, a simple HTML container, AtomDataLoader to enable data loading and EventSystem to call Webix events.
Also, we have included specific methods into the prototype:
- $init – contains the logic called during initialization, and here it describes basic rendering pattern;
- $setSize – contains the logic called when the widget is resized in Webix environment, and here it forces the D3 chart to adjust to the new dimensions.
Following these simple steps you can embed any visual instrument into the application based on our UI library. This is a valuable investment into your future projects, but at this very moment you can use the D3 charts in their full beauty just as:
Conclusion
D3 charts are bright and spectacular data visualization tools. You can add a lot of charm and value to your application without worrying about possible integration collisions. The one who can choose the best pieces of software and combine them all together to achieve the best result wins in the competitive online world.