It’s common knowledge that chart is a convenient tool for arranging and manipulating information. Charts can present large amounts of data in a simple schematic way. Keeping up with the times, Webix Library offers a possibility to integrate with popular charts of such Javascript libraries as D3, Raphael, Sigma and JustGage. At the same time, Webix has a collection of its own charts.
Building Chart View
You don’t need to write a lot of code in order to add third-party charts into a Webix application since it’s done with the help of dedicated Webix components.
However, these components aren’t included into the default lib package, so you have to download a JS file for the needed component from Webix open repository of helpers.
This special javascript file will connect your app to the necessary chart and autoload all the corresponding chart files.
The next step is to include the code file you’ve downloaded into the head section of your document. So for embedding a D3 Chart the following line should be used:
Then you can initialize the chart using the code below:
webix.codebase = "./";
webix.ui({
view:"d3-chart",
url:"...",
ready:function(){...};
});
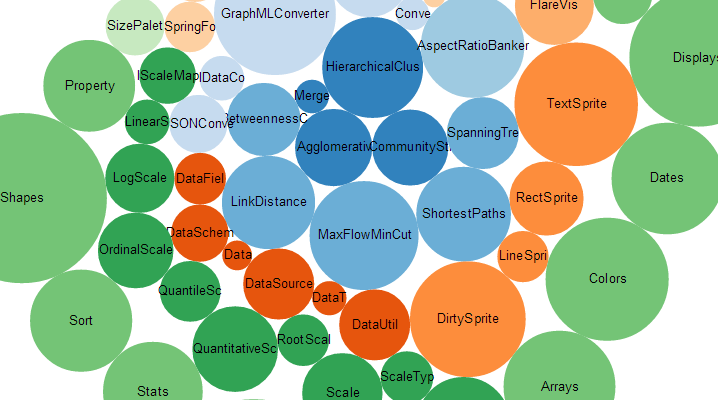
Constructors for Raphael, Sigma and D3 charts are almost identical. Generally, they include the following properties:
- view – defines the name of the chart view – d3-chart, justgage-chart, raphael-chart, sigma-chart;
- url – specifies data source for the chart (data file or script);
- ready – function that is executed when the component is fully loaded. It contains the needed chart’s source code available on the dedicated site.
Thus we get a nice d3-chart on the page. Check its live demo.
Sigma Chart Specificity
To configure the Sigma Chart you need two of the above-mentioned properties, view and url:
webix.codebase = "./";
webix.ui({
view:"sigma-chart",
url:"./data/les_miserables.gexf"
});
The integrated chart supports 2 plugins for the Sigma Chart (“fisheye” and “forceAtlas2”) that are described in tutorials on their site. By default, it uses a “fisheye” one. GEXF data format is also supported.
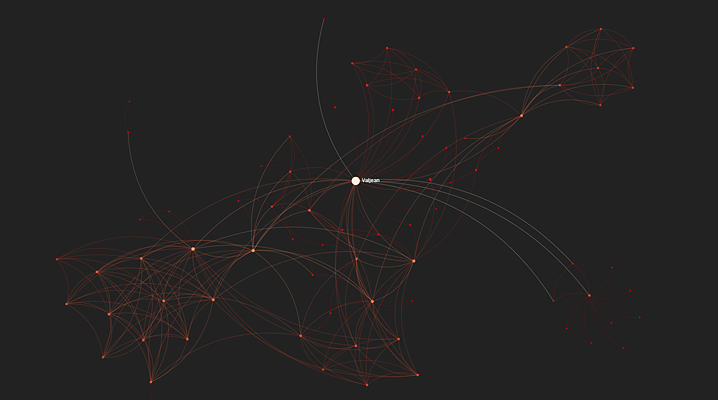
View the live demo of Sigma Chart.
You can also write your own plugin and include it into the sigma-chart Webix component. For more information, see the documentation.
JustGage Chart Specificity
As for the Justgage Gauge chart, its configuration is simpler and can be defined directly in Webix component:
webix.codebase = "./";
//constructor function
webix.ui({
view:"justgage-chart",
value:25,
title:"Positive",
height:300,
min: 0,
max: 100
});
where the properties define the following:
- value – initial chart value;
- title – name of the chart;
- height – height of the chart gauge;
- min – min chart value;
- max – max chart value
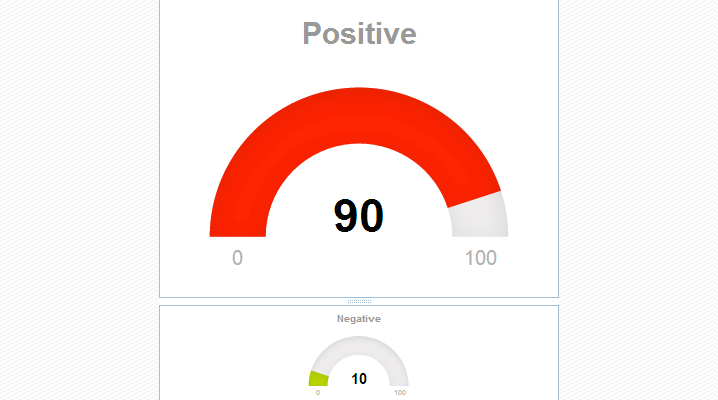
Check the live demo.
Summing up
As far as you can see, Webix way of integration with third-party charts is rather nice and simple. You need just to choose the chart you like most, add a couple of code lines and it will appear on the page. To learn more on the topic, refer to the documentation article.