In this article, we compare 2 widgets of different generations. They are dedicated for working with diagrams. These are the outdated Organogram and a new member of the Webix family – Diagram widget, that came with the 8.3 spring release.
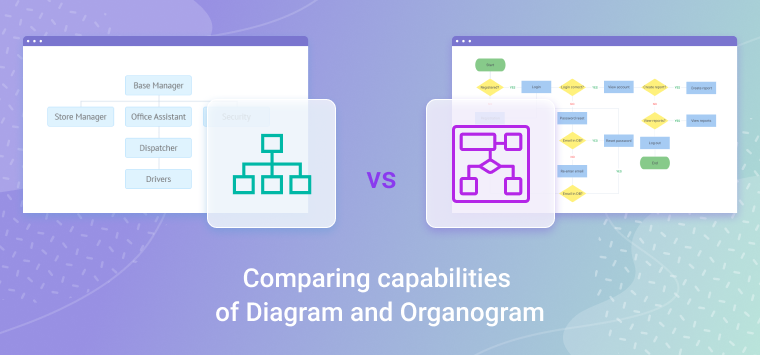
Both widgets are designed for building charts, yet their functionalities differ wildly. We can give an analogy with the capabilities of a tricycle and a sport bicycle. In this situation, the Organogram can be thought of as a tricycle. You may move around on it, but over long distances, such a bike is of little use.
The Diagram widget is a complete game changer. It is like a sport bike – fast, dependable and maneuverable. Its capabilities allow you to feel confident both at short and long distances.
Let’s proceed to the comparison of these widgets.
Marketing Differences
Currently, the Organogram widget is still available as a part of the standard Webix Core package. However, the widget is deprecated and starting from version 9.0 it will be completely removed from the Webix Core package.
The new Diagram widget will not be included in the standard Webix library. To purchase Diagram, you need to get acquainted with the prices of existing packages and choose the desired one for you. Read more about this on the Licensing and Pricing page.
Technical Differences
Chart structures
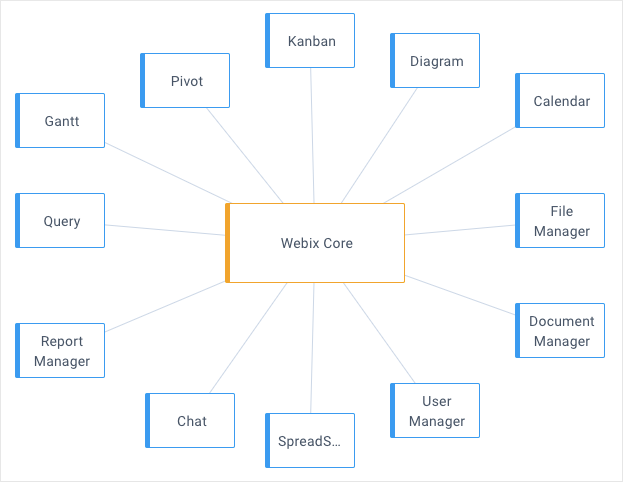
The Organogram supports only hierarchical relationships between blocks. To draw the diagram, the widget needs the corresponding tree-like data.
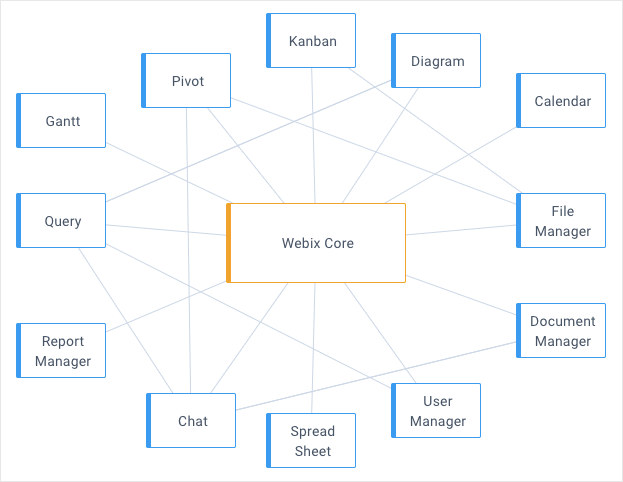
The new Diagram widget doesn’t have such restrictions. Besides the tree-like dependencies between blocks, you can visualize any type of block relations that is required by your project. Moreover, in the new widget, the data for blocks and links are separated, which allows you to expand the process of charting significantly.
SVG Block Shapes
The Organogram widget doesn’t support built-in SVG shapes. Each block of the diagram is a plain HTML element. You can just set the desired shape using CSS properties.
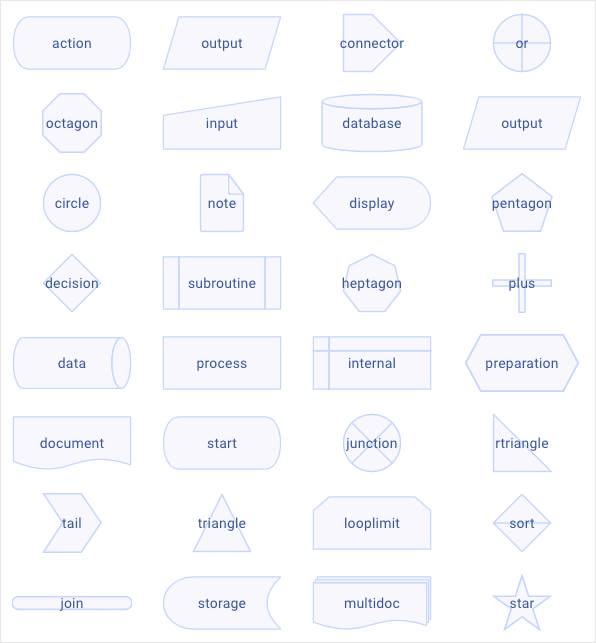
In addition to the regular blocks, Diagram allows you to work with any SVG shape. You can use the built-in shapes, modify and style them to your liking, as well as add and customize your own SVG shapes. The only restriction is your imagination.
Arranging Blocks and Links
Organogram can only autoplace the blocks and links between them. Auto placement is not always convenient, especially when you need a high precision.
Diagram, on the contrary, allows you not only to autoplace blocks and links but also set fixed coordinates for them. You can also connect any blocks of the chart.
Styling links
Organogram doesn’t support styling and managing links between blocks. They are arranged automatically, depending on the tree-like data structure.
Diagram allows you to control both the placement of links and their look. You can set the mode of link, provide coordinates to place links by, as well as add an arrow and style it as you like.
Working with Margins
The indent calculating system of the Diagram widget is slightly different from that in Organogram. You can set vertical and horizontal margins in relation to the default block placement. For this, you can use the new margin property. The same margins can be set separately via the corresponding marginX and marginY properties. In Organogram, these two properties define the immediate distance between blocks. For the blocks list, you can set a separate margin via the listMarginX property only.
Migration from Organogram to Diagram
If you are accustomed to work with Organogram and think that it is difficult to migrate to Diagram, then I can assure you that it is not at all. In the examples below, you can see how to create identical charts on the Organogram and Diagram widgets.
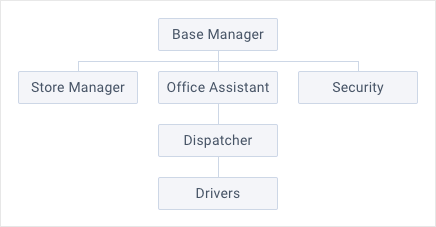
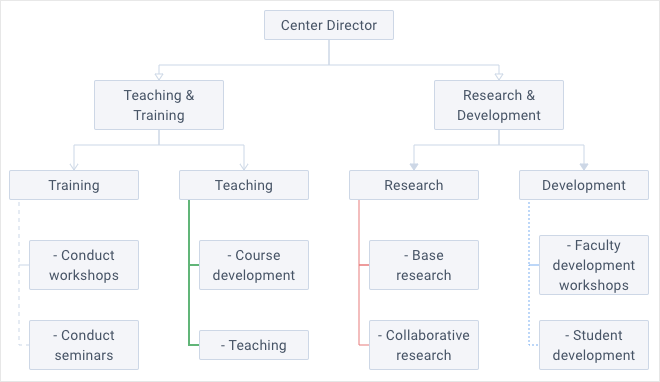
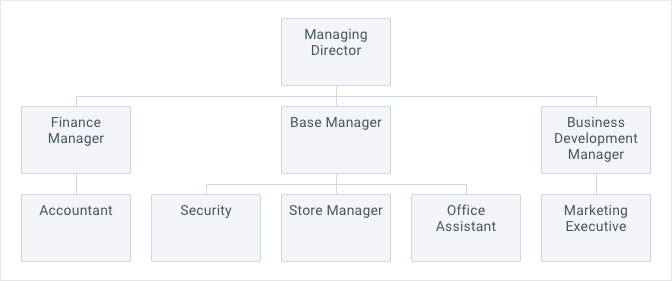
We will take this tree-like chart as an example:
Organogram
The Organogram code looks like this:
view:"organogram",
item:{
width:110,
height:70
},
select:true,
data:tree
});
The tree-like data for this diagram is loaded via the data property and look like this:
{ id:"1", value:"Managing Director", data:[
{ id:"1.1", value:"Finance Manager", data:[
{ id:"1.1.1", value:"Accountant" }
]},
{ id:"1.2", value:"Base Manager", data:[
{ id:"1.2.1", value:"Security" },
{ id:"1.2.2", value:"Store Manager" },
{ id:"1.2.3", value:"Office Assistant" }
]},
{ id:"1.3", value:"Business Development Manager", data:[
{ id:"1.3.1", value:"Marketing Executive" }
]}
]}
];
In the following example you can see how the Organogram widget works. You can also experiment with the data here.
Diagram
Now let’s implement the same chart using the Diagram widget. The code looks like this:
view:"diagram",
item:{
width: 110,
height: 70
},
select:true,
data:tree,
links:tree_links
});
As you can see, the relative differences are minor. You need to consider that the Diagram requires 2 corresponding data sources, separately for blocks and links.
Data for blocks:
{ id:"1", value:"Managing Director" },
{ id:"1.1", value:"Base Manager" },
{ id:"1.1.1", value:"Store Manager" },
{ id:"1.1.2", value:"Office Assistant" },
{ id:"1.1.3", value:"Security" },
{ id:"1.2", value:"Business Development Manager" },
{ id:"1.2.1", value:"Marketing Executive" },
{ id:"1.3", value:"Finance Manager" },
{ id:"1.3.1", value:"Accountant" }
];
Data for links:
{ source:"1", target:"1.1" },
{ source:"1.1", target:"1.1.1" },
{ source:"1.1", target:"1.1.2" },
{ source:"1.1", target:"1.1.3" },
{ source:"1", target:"1.2" },
{ source:"1.2", target:"1.2.1" },
{ source:"1", target:"1.3" },
{ source:"1.3", target:"1.3.1" }
];
As it might be seen, the migration from Organogram to Diagram is as easy as pie. In the following example, you can see how the Diagram widget works. You can also experiment with the data here.
Further development
The Webix team will no longer support the Organogram widget. Starting from version 9.0, Organogram will not be included in the standard Webix Core package.
At the same time, our developers work hard to deliver a visual editor for Diagram that will allow users to manage diagrams in a handy way.
Conclusion
In this article, we discovered the main differences between Organogram and Diagram, touched upon the marketing nuances and figured out how to migrate from the outdated Organogram to the new Diagram smoothly. You can learn more about all the features of the Diagram widget on the documentation page.