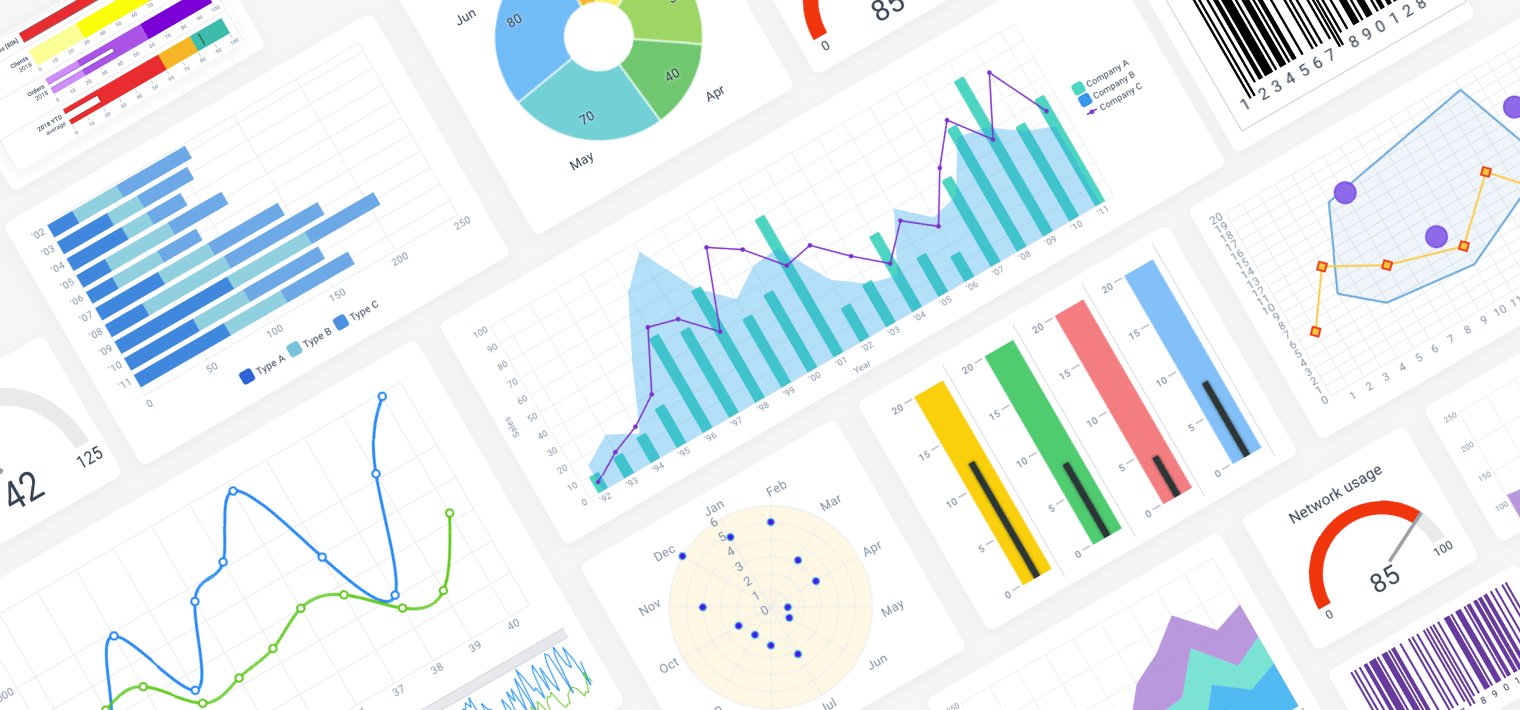
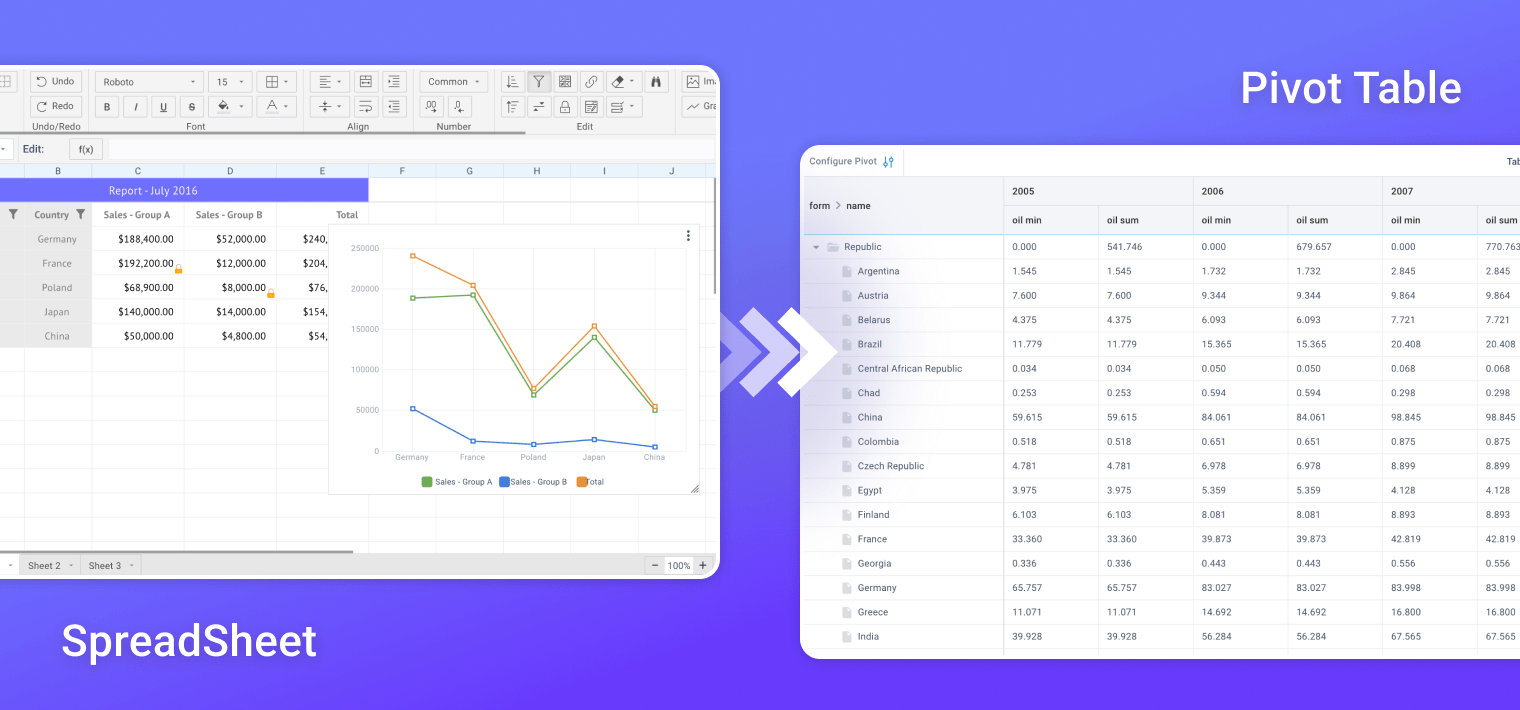
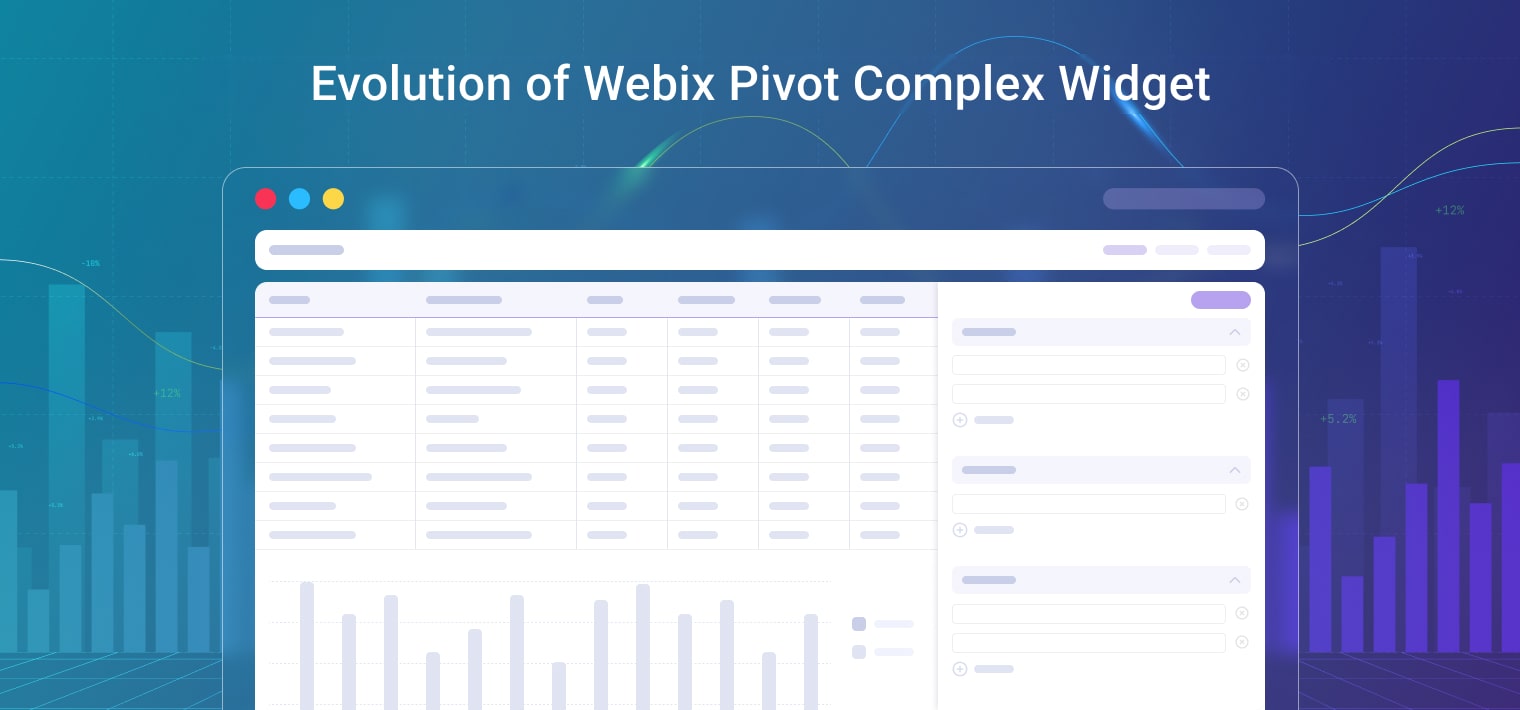
Today, we’d like to walk you through a real-world use case: transforming data from Webix SpreadSheet into Pivot Table. You’ll learn how to integrate two advanced widgets to implement more complex scenarios in your application.
We continue our series of articles on the evolution of Webix complex widgets and today we are going to plunge into the history of the Webix JavaScript Pivot Table – elaborating on the major changes the widget has undergone and the enhancements it is constantly receiving to ensure the users are provided with a wide range of possibilities facilitating their interaction with data.
As you may know, we celebrated the 10-year anniversary of Webix this summer. It’s been an incredible journey, and we want to express our heartfelt gratitude to all our users and supporters.
In the meantime, our development team didn’t rest on their oars during this milestone celebration. Instead, we dedicated ourselves to preparing a noteworthy release for you. This time everything revolves around new features for our beloved complex widgets: Chat, Pivot and SpreadSheet. Let’s dive into the details together!
We have some exciting news to share with you: the long-awaited release of Webix 10.1 is here! This version is packed with powerful enhancements and impressive updates to our complex widgets. In addition to the features mentioned in the title, we prepared the “zoom” feature for SpreadSheet, some advanced “Chart” mode settings for Pivot, and many more. Let’s take a look together at all the features that Webix 10.1 has to offer.
This year, Christmas came early for all Webix fans around the world. The Webix team is proud to present to you Webix 10.0. We put our all into work this summer and fall to give you the most breathtaking update of the year. The anniversary version of our library includes:
Read on if you want to know the details about all exciting features and updates.
Learn about our guest posts guidelines