New Webix 5.0 includes the JavaScript GeoChart widget created with Google Maps API. GeoChart is a pretty neat service for creating map charts for presenting data associated with countries and regions. I’ll show you how to use the main features of the widget to create an interactive world map. If you are not yet familiar with the widget, I hope that GeoChart will become your faithful friend after I introduce it to you. If you already love GeoChart as much as I do, you will probably gain a better insight into things you can do with it.
Basic GeoChart to Display Data
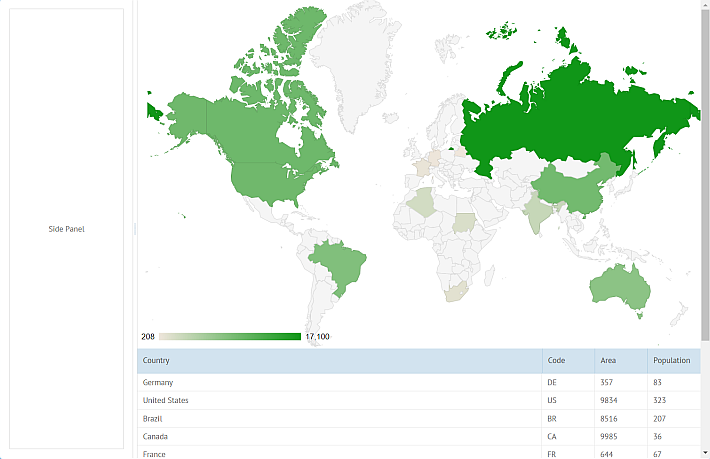
First, let’s show data in the readonly mode. The layout of the app will have three panels:
- the map
- the side panel with controls
- the bottom panel with data records
Before initializing GeoChart, don’t forget to get your personal key.
A few lines of code will add GeoChart into the app. Here’s a simple map with small data:
view:"geochart",
id:"map",
// provide your own Google API key
// https://developers.google.com/maps/documentation/javascript/get-api-key
key:"AIzaSyAi0oVNVO-e603aUY8SILdD4v9bVBkmiTg",
data:[
{id:1, country:'Germany', code:"DE", area:357, population:83 },
{id:2, country:'United States', code:"US", area:9834, population:323 },
{id:3, country:'Brazil', code:"BR", area:8516, population:207 },
//...
]
});
In real-life apps, data are more often loaded from a server. For the demo, I’ll create a DataCollection and sync the map with it. I’ll do this because I plan to show the same data on the GeoChart and as a list of data records below the map.
{id:1, country:'Germany', code:"DE", area:357, population:83 },
{id:2, country:'United States', code:"US", area:9834, population:323 },
{id:3, country:'Brazil', code:"BR", area:8516, population:207 },
//...
Note that GeoChart doesn’t have its own data source, as the data is taken from the DataCollection:
view:"geochart",
id:"map",
// provide your own Google API key
// https://developers.google.com/maps/documentation/javascript/get-api-key
key:"AIzaSyAi0oVNVO-e603aUY8SILdD4v9bVBkmiTg"
};
For data records, I’ll create a JS DataTable:
view:"datatable", id:"grid", autoheight:true,
scroll:false, autoConfig:true
}
Here’s the layout:
cols:[
form,
{ view:"scrollview", body:{
type:"clean", rows:[
map,
grid
]
}}
]
});
form for now is just a template that reserves space for controls on the side panel. The map and the DataTable are enclosed into a scrollview to adapt the demo for resizing. For the same purpose, I disabled the default scroll of the grid.
To synchronize the GeoChart and the DataTable with the DataCollection, call sync:
$$("grid").data.sync(mapdata);
GeoChart Modes
GeoChart has a lot of options that can change the look of the map. For example, there are three ways to mark areas with related data:
- regions – colors areas of the map (used by default);
- text – adds colored labels of different sizes;
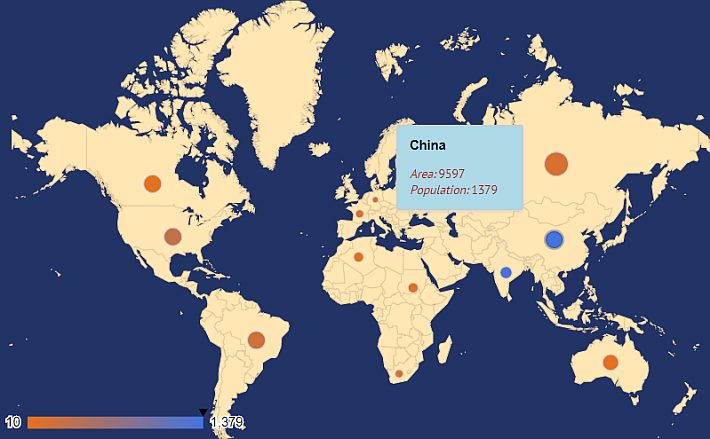
- markers – adds colored bubbles of different sizes.
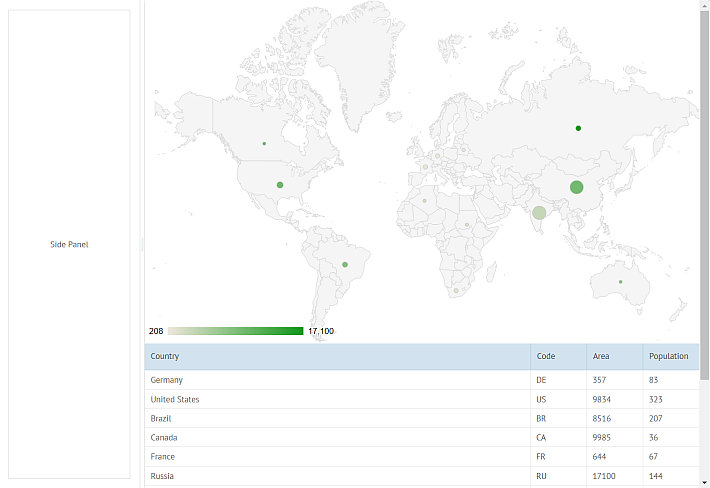
I can change the mode by setting the chart.displayMode property. For instance, to show bubbles on the chart, I’ll set the property to markers:
view:"geochart",
//...config
chart:{
displayMode:"markers"
}
});
If the data have several columns, the size of bubbles depends on the second numeric column – population in my data.
I can also change the mode dynamically with setDisplayMode(“markers”). For example, let’s add a segmented button that will switch the GeoChart to different modes. I’ll place the button on the side panel:
view:"form", id:"chartForm", elements:[
{view:"segmented", id:"modes", value:"Regions",
options:["Markers","Regions","Text"],
click:function(){
$$("map").setDisplayMode(this.getValue().toLowerCase());
}}
]
};
I’d like to be able to hide the side panel. That’s why I’ll put the form into Webix Accordion:
header:"Configure", body:{
width:300, type:"wide", rows:[
chartForm
]
}};
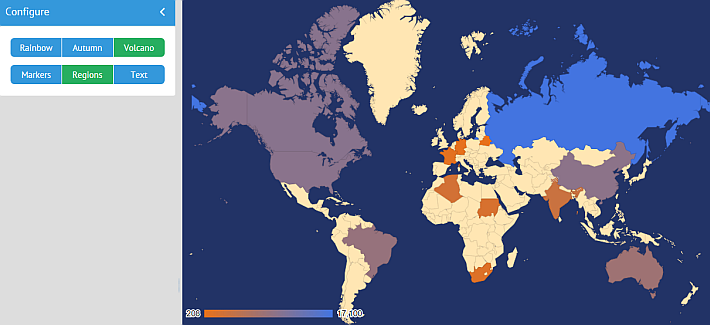
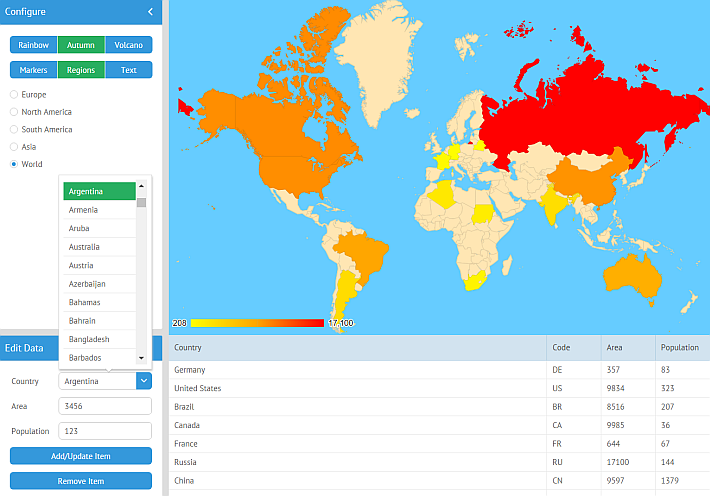
Legends and Colors
Let’s brighten up GeoChart. First, I’ll alter the color scheme of the legend and paint the map in the rainbow colors. To do so, I’ll set the chart.colorAxis property of GeoChart:
colorAxis: {
colors:['violet','indigo','blue','green','yellow','orange','red']
}
//...
}
Of course, the colors attribute also accepts hexadecimal values. The color scheme of the legend can also be changed dynamically by setting config.chart.colorAxis. Let’s add other color schemes and a button to switch between them:
options:["Rainbow", "Volcano"],
click:function(){
var color = this.getValue();
switch(color){
case "Rainbow":
$$("map").config.chart.colorAxis = {colors: ['violet','indigo','blue','green','yellow','orange','red']};
$$("map").refresh();
break;
case "Volcano":
$$("map").config.chart.colorAxis = {colors: ["#e7711c", "#4374e0"]};
$$("map").refresh();
break;
}
}}
Don’t forget to refresh GeoChart after changing color schemes to re-render the chart with new colors.
Now I’ll change the background color with the chart.backgroundColor property. The color of areas with no data can be set with chart.datalessRegionColor.
The legend of the map can be further configured and even hidden. For more details, check out the Google GeoChart API.
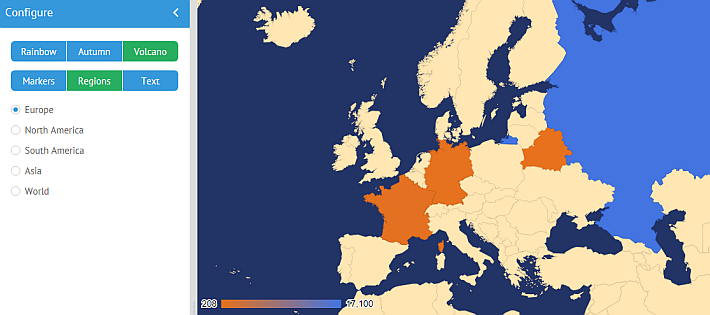
Regional and Country GeoChart
I also want my interactive map to show specific regions or countries. This can be done with the chart.region property. It accepts country codes like ‘US’ or ‘BY’, region number codes like ‘142’ (for Asia) and ‘world’. You can find the list of supported codes in Continent Hierarchy and Codes.
Apart from setting the initial regional config of GeoChart, I can change the displayed region dynamically with setRegion(“code”). Let’s add a radio control to the side panel. Radio will switch GeoChart from the world view to other continents:
options:[ {id:1, value:"World"}, {id:2, value:"Europe"} ],
click:function(){
var region = $$("regions").getValue();
switch(region){
case "1":
$$("map").setRegion("world");
break;
case "2":
$$("map").setRegion("150");
break;
}}}
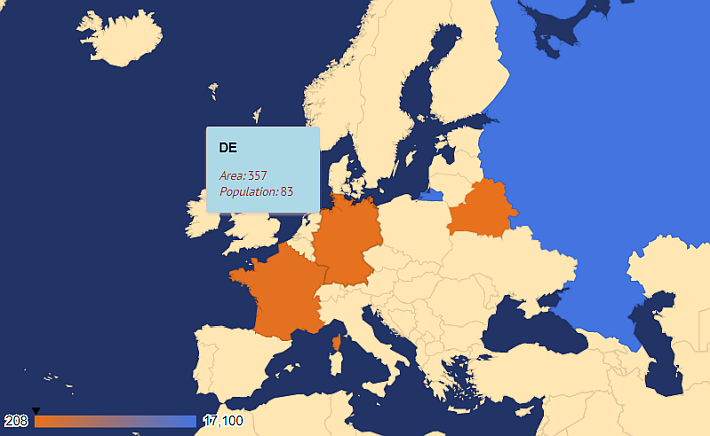
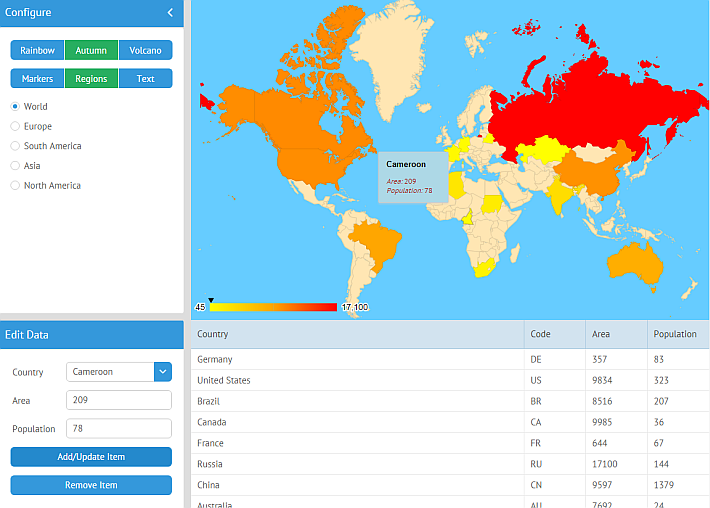
Tooltips
In addition to visual presentation, Webix GeoChart has HTML tooltips that show details on each area in the dataset. Tooltips appear when users hover a mouse pointer over a region or a bubble. By default, tooltips show a list of all the data columns. I can change the default content of tooltips by enumerating the columns I want to show, e.g. with this code the tooltip will show only area:
Besides, I can style tooltips. I’ll do this by accessing the .google-visualization-tooltip class:
background-color: lightblue;
border: 1px solid #ccc;
box-shadow: 0 2px 2px 0 rgba(204, 204, 204, 0.6);
}
You can check out this useful post on Stack Overflow. You will find more detailed advice on styling tooltips there.
Data with Multiple Columns
In the case of data where items are compared by several parameters, for example, by area and population, I can choose which parameter to display on the map. The rest of the columns can be displayed in tooltips. To get this behavior, I’ll change the order of the fields in the columns property. Let’s make population the column that will define chart colors. Have a look:
view:"geochart",
id:"map",
key:"...",
columns:["country", "population", "area"],
//...
}
The size of bubbles now depend on the area.
Interactive GeoChart
Interactivity in Webix GeoChart is enabled by default. I can click on regions and bubbles. If there are related data, the area will be highlighted. I will expand interactivity further with the onItemClick event. E.g. let’s select a row in the DataTable with data on the same area:
view:"geochart",
id:”map”,
key:"...",
on:{
onItemClick:function(id){
$$("grid").select(id);
}
}
};
onItemClick fires when you click on a colored region or a bubble, meaning areas with data.
I want to do something when I click any area, including those without any data. One more click event is available – onRegionClick. This event fires only in the regions mode. For example:
view:"geochart",
id:"map",
key:"...",
on:{
onRegionClick:function(obj){
webix.message(“Region code ”+obj.region);
}
}
};
The event handler receives an object with the region code. In the next step, I’ll show you a more useful example of handling these events.
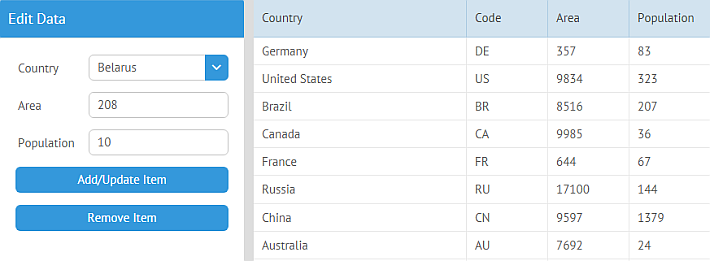
Using GeoChart to Edit Data
As GeoChart is a data component, I can load, edit, and remove data from it just as with other data components. Let’s add a form for editing, adding and deleting GeoChart items:
view:"form", id:"editForm", elements:[
{ view:"combo", name:"country", options:countries },
{ view:"text", name:"area", label:"Area" },
{ view:"text", name:"population", label:"Population" },
{ view:"button", value:"Add/Update Item" },
{ view:"button", value:"Remove Item" }
]
};
combo takes its options from a DataCollection that contains all country names and region codes:
url:"https://docs.webix.com/samples/36_geochart/data/countries.json"
});
/* countries.json
[
{
"value": "Afghanistan",
"code": "AF",
"id": "Afghanistan"
},...
]
*/
When a country is chosen, I want to fill the form with data if the country already exists in the dataset. If there are no data for the selected area, let the form be empty. To look for data items, I can call the find method of the GeoChart. However, as the map in the demo is synced to a DataCollection, I can look for items with the same method of mapdata:
on:{
onChange:function(newv){
//is the country in data?
var item = mapdata.find(function(obj){
return obj.country.toLowerCase() === newv.toLowerCase();
});
if(item.length)
this.getFormView().setValues(item[0]);
else {
//if not, get its code
var itemc = countries.find(function(obj){
return newv === obj.value;
},true);
this.getFormView().setValues({country:newv, code:itemc.code, id:", area:", population:"});
}
}
}}
If I select a country from the combobox, this country name will be compared to names in the map data. mapdata.find returns an array with the item from the dataset if it has been found. If the country hasn’t been found, it returns an empty array.
Next, if there are no data related to the selected country, the region code will be taken from the big data collection with countries.find.
If the item array is not empty, the form is filled with real values. Otherwise, it gets the country name and the code, other controls are filled with empty strings. Note the empty string passed to id. I’ll use it later as a flag to check whether the country is already in the DataCollection.
Adding and Updating Items
Now I want to add and update data items. There are two cases here:
- the country is already in the dataset;
- I’m adding a new country.
To deal with the first case, let’s use the updateItem method of the mapdata DataCollection. GeoChart has the same method. updateItem takes two parameters: the ID of the item and the item itself as an object.
var values = this.getFormView().getValues();
if(values.id)
mapdata.updateItem(values.id, { area:values.area, population:values.population});
}}
values.id is truthy if the country is in DataCollection.
Now let’s deal with the second case: adding a new country to the dataset. I’ll use the add method that receives one mandatory parameter – the country object.
var values = this.getFormView().getValues();
if(values.id)
mapdata.updateItem(values.id, { area:values.area, population:values.population});
else{
mapdata.add({ country:values.country, code:values.code, area:values.area, population:values.population});
}
}}
It would be a good idea to validate form inputs. First, I’ll add validation rules to the form:
view:"form", id:"editForm", elements:[
//elements
],
rules:{
area:webix.rules.isNumber,
population:webix.rules.isNumber,
country:function(value){ return value != 0; }
}
};
Now I’ll add validation to the Add/Update button handler:
if(this.getFormView().validate()){
var values = this.getFormView().getValues();
if(values.id)
mapdata.updateItem(values.id, { area:values.area, population:values.population});
else{
mapdata.add({ country:values.country, code:values.code, area:values.area, population:values.population});
}
}
}}
As I add or update an item in mapdata, the list of records in the DataTable is also updated.
Removing Items
Now let’s enable removing items from GeoChart. I must check if the item exists before removing it. I’ll use the id value of the form as a flag again. Both GeoChart and DataCollection have the remove method, let’s use it.
if(this.getFormView().validate()){
var id = this.getFormView().getValues().id;
if(id){
mapdata.remove(id);
this.getFormView().clear();
}
}
}}
remove deletes the country only after the input is validated and if the item exists within the dataset. After the item is deleted, the form is cleared.
One More Thing with Interactivity
Here is one more example of how to enhance interactivity with onClick events. It’s pretty handy to edit items with a click on the map. To update countries from the DataCollection, I will handle onItemClick:
onItemClick:function(id){
$$("editForm").setValues(this.getItem(id));
$$("grid").select(id);
}
}
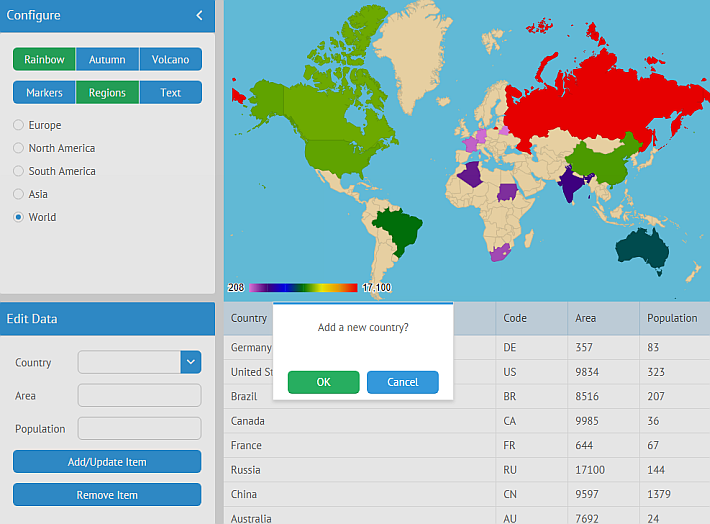
Well, that was easy. Next, I want to add new countries by clicking dataless regions. This task will be trickier, because onRegionClick fires for regions with and without data.
I will take the region code received by the event and compare it to codes in the list of countries marked on the map. Then if the search result is empty, a Webix confirm dialogue will ask users whether they want to add a new data record. If yes, they can proceed to add a new item.
var code = obj.region;
var item = mapdata.find(function(obj){
return obj.code === code;
});
if(!item.length) {
$$("grid").clearSelection();
webix.confirm("Add a new country?", function(){
//...add the country
});
}
}
Then I will get the country name by comparing codes from the list of all countries. After the name is found, the combo value will be changed.
if (result) {
var newv = countries.find(function(obj){
return obj.code === code;
},true);
$$("editForm").setValues({country:newv.value});
}
});
And here’s the live demo with complete source code.
Before You Dash Off to Enjoy GeoChart…
GeoChart is good for presenting different statistical data associated with regions, countries or states. You can adapt GeoChart to your needs and use it in apps for business, education, reports, or just for the fun of it. If you have more ideas and tips on GeoChart, I’ll be happy to hear from you 🙂
Get the demo and play with it. If you feel like digging deeper for more details about GeoChart, check out Webix documentation and Google documentation.